Module 2
Chapter 1
1. Introduction
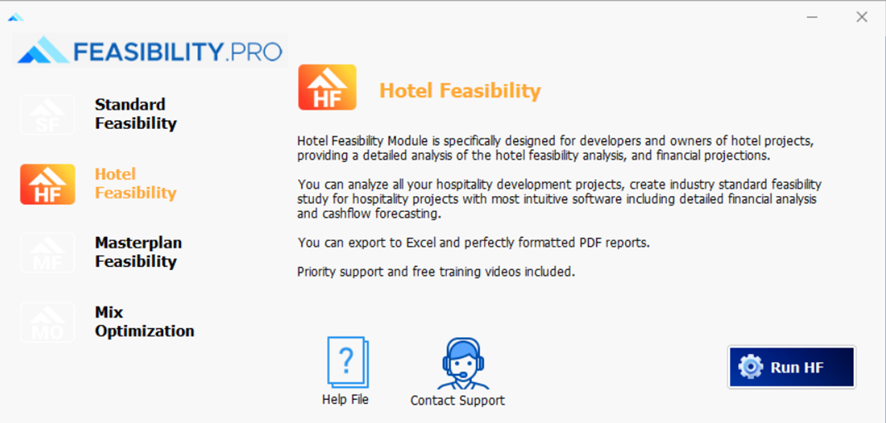
Feasibility.pro Hotel Feasibility Module (HF) is a cash flow model designed for hotel development feasibility analysis. It calculates investment returns including residual land value, development profit, internal rate of return and net present value based on a comprehensive set of inputs.
The Program can be used to:
- Financially appraise hospitality asset development and test project feasibility.
- Estimate residual land value for acquisition purposes based on development data provided.
- Estimate the value of land for the purpose of disposal; and
Feasibility.pro Hotel Feasibility Module (HF) is also suitable, or adaptable, for:
- Cost-benefit analysis.
- Valuation tool to calculate a site's residual value based on development data provided; and
- Post-project evaluation.
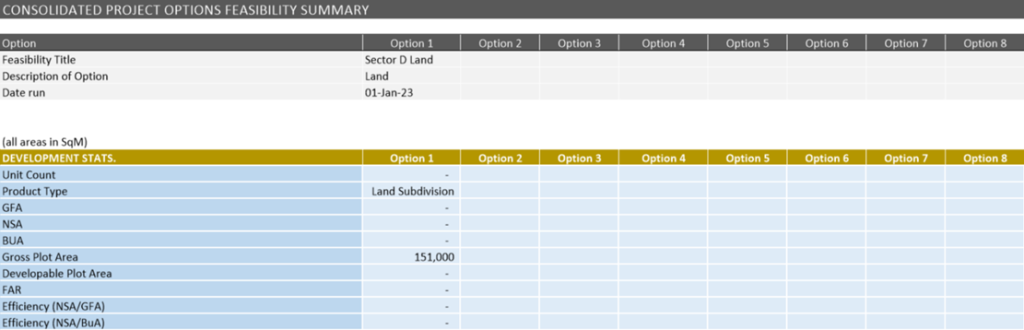
It is also exceptionally suitable for checking the viability of various test-fit options (8 options can be run, stored and compared in a single file).
1.1. Program Integrity
Every effort has been made to provide a quality product that is simple, flexible, and detailed in its analysis.
Feasibility.pro Hotel Feasibility Module (HF) program has been protected to safeguard the integrity of the program and formulae. If the protection is broken the validity of the formulae and program calculations cannot be guaranteed anymore. Therefore, we recommend that the authors be notified of any problems rather than the user attempting to rectify the problem by removing the protection facility.
To this end any modifications to the Feasibility.pro Hotel Feasibility Module (HF) program are prohibited without the express written approval of Feasibility.pro Inc.
Also, we cannot guarantee that the program is or will remain error-free for every possible input permutation. To retain the integrity of the program we recommend you audit the models regularly with manual reality checks on the output results.
Furthermore, the program assumes certain tax assumptions such as rates of stamp duty and Escrow calculations. These may change in time, and it is important for the user to keep abreast of such changes and know how they affect the model's assumptions.
1.2. Software Requirements
To install and operate Feasibility.pro Hotel Feasibility Module (HF) efficiently, the following are some recommended:
- A 64bit PC with a Quad Core CPU (Intel Core i5 / i7) and a clock speed of at least 2.8Ghz (or equivalent).
- Microsoft Windows 8.1 or later -or- Windows Server 2012 or later
- Microsoft .Net Framework 4.6 or higher.
- 8GB RAM or higher.
- Internet connection (for downloading files and activating licenses).
Chapter 2
2. INTRODUCTION TO HOTEL FEASIBILITY MODULE (HF)
2. Introduction to Hotel Feasibility Module (HF) Key Concepts
2.1 Development Margin
Before the widespread use of computer programs for real estate feasibility analysis, the traditional approach to development analysis was:
Estimate the total development cost for a project in current dollars including interest on borrowings.
- Estimate the sale prices (less selling costs) based on comparable sales or income capitalization expressed in current dollars.
- Calculate the net profit by subtracting total development cost from revenue; and
- Calculate the development margin by dividing profit by total development cost:
| Development Margin | Net Profit*100% |
| Total Development Cost |
Through experience, a 15% to 30% development margin was considered adequate for a project to be viable, although this would vary according to the level of project, financial, and market risk.
This method of determining the project viability completely ignores the time value of money.
2.2 Time Value of Money
The traditional development method of project appraisal however was recognized to be flawed when one or more of the following factors were involved:
- Inflation and above inflation escalations occurred with costs and sale values.
- Project periods extended beyond two or more years.
- Other medium-term investments competed for funds; and
- Costs and sales were staged giving variable cash flow exposures.
The analytical drawback is that the traditional approach does not account for the time value of money. Usually, a dollar today is more valuable than a dollar next year. Future cash flows should therefore be discounted in value to reflect their present value.
To demonstrate the time value of money, consider the case in which an individual receives a sum of $1,000 and invests it at a return of 10% per annum compounded in Government Bonds. The $1,000 will grow to $1,100 at the end of year 1 and $1,210 at the end of year 2 and so on. It is assumed that this 10% return represents the best use for the funds at a risk-free rate. In this example, the investor should value $1,100 in a years’ time or $1,210 in two years’ time as equivalent to $1,000 now (i.e., its present value). The reduction of future dollars to its equivalent value in money today is known as discounting.
Discounting is the reciprocal of compounding and is expressed in the following formula:
| PV= | FV |
| (1+i)n |
2.3 Discounted Cash Flow Analysis
Discounted Cash Flow (DCF) analysis considers the time value of money in a much more detailed way than the developer's profit margin by considering the timing of all costs and incomes.
The first requirement of discounted cash flow analysis is to create a tabulation of money and time with cash flow items along one axis and time on the other axis. In other words, the same cash items used in the traditional approach (except interest on finance), are tabulated against equal time periods (months, quarters or years) and the values of those cash items are recorded in the period forecasted.
Interest is excluded because it is incorporated in the discount rate as demonstrated above.
The value of all the cash items is then totaled for each time period (with cost items being negative and revenue items being positive) resulting in a net cash flow range through time. This range of net cash flows is discounted to present value. The resultant net present value (NPV) measures the difference between the discounted revenues and the discounted costs. This is the first and perhaps the most important performance indicator. A positive NPV implies the present value of income exceeds the present value of costs and the project is therefore feasible.
The other primary indicator is the internal rate of return (IRR). This is the discount rate at which the net present value equals zero. Possibly a better way to understand its meaning is to express it as the maximum interest rate that can be charged to a fully funded project before the project shows a net loss.
2.4 Performance indicators
Development Margin
Is used as a reflection of profitability and is the percentage return of net profit over total development cost calculated in the following way:
| Development Margin = | Net Profit*100% |
| Total Development Cost |
Where:
Net Profit = Total Revenue less Total Development Cost; and
Total Development Cost includes all finance and interest charges, land holding, and selling costs.
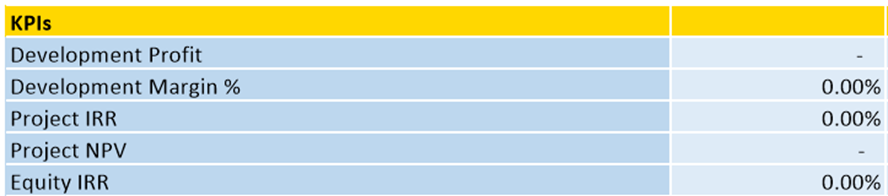
Net Present Value (NPV)
NPV is the sum of the present values of all project cash inflows and outflows over the life of the project. A positive NPV infers an Internal Rate of Return (IRR) greater than the discount rate. Interest on borrowings and interest received on re-investment of surplus funds and equity is ignored since this is incorporated in the discount rate. The formula is:
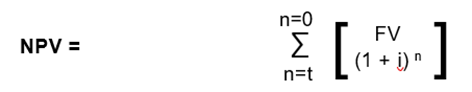
Where:
PV=Present Vale
FV= Future Value (Predicted Amount)
i= Discount rate per period
n= Number of periods
Internal Rate of Return (IRR)
IRR is the discount rate at which the sum of the discounted negative cash flows equals the discounted positive cash flows, i.e., the discount rate at which the NPV equals zero. Simplistically the IRR represents the actual return on funds invested. Interest in borrowings is ignored since this is incorporated in the discount rate.
2.5 Discount Rate
Discount Rate (or Target IRR) is simplistically the desired return on funds invested. For discounted cash flow analysis, the discount rate is the rate at which future cash flows are discounted to present value. For a development to be feasible the discounted value of future cash flows (Net Present Value) must be greater than zero. A feasible project will have an internal rate of return (forecast return) greater than the discount rate (desired return).
A simple and popular method for choosing a discount rate in discounted cash flow analysis is an "Opportunity Cost of Capital" rate, which is given, in the following formula:
Discount Rate = Inflation + Risk Free Rate of Return (Cost of Capital) + Risk Premium
The risk-free rate of return or cost of capital reflects the opportunity cost in not proceeding with the development. It may be defined by the current 5–10-year Government Bond rate. Note this includes an expectation of long-term inflation. If a zero-inflation model is adopted, then a medium-term market forecast of inflation should be subtracted from the Government Bond rate to calculate the real risk-free rate of return.
Risk Premium
Risk Premium is the level of discounting over and above the risk-free rate (or cost of capital), which reflects the level of risk in the project.
Weighted Average Cost of Capital
A more sophisticated method of calculating the discount rate is the WACC which is the weighted required rate of return on debt and equity funding. The formula is as follows:

Where
D= Total Debt
E= Total Equity
RD = Cost of Debt (risk-free rate of return plus debt premium based on the credit rating of the company); and RE = Cost of Equity (required return on equity)
TR = Corporate Tax Rate
A popular method of calculating the required return on equity is the capital asset pricing model (CAPM). The formula is:

Where:
RE = expected return on equity.
RF = risk-free rate of return (10-year Government Bond rate).
ß = sensitivity of an investment's return to the return on the hypothetical market portfolio of shares.
RM = expected nominal return on the market portfolio (approximated by the yield on the market portfolio of common equity shares); and
(RM - RF) = the market risk premium, or additional return demand by investors for holding risky assets.
2.6 Risk Assessment
Risk refers to the degree of uncertainty and/or potential financial loss inherent in an investment decision.
Risk is usually dealt with in several ways:
- Incorporating a risk premium in the discount rate. This is based on the concept that developers and investors expect higher returns for more risky projects.
- Use of sensitivity testing whereby different low, medium, and high values for risky variables are incorporated to test the effects on the performance indicators.
- Application of Scenario Analysis, which records the results from a combination of variations.
- Application of Probability Analysis to produce a probability distribution of outcomes.
The second method has an advantage over the first method since combinations of different values for different risky variables can provide a range of outcomes. However, neither method provides a consideration of the probability of those outcomes. The Monte Carlo method assigns probability distributions to the risky variables but because of its complexity and limitations, this method is not often used in the property development industry.
2.7 Residual Land Values (RLV)
Residual Land Values in Hotel feasibility (HF) is calculated on the target development margin.
RLV on Target Development Margin
The RLV on the Target Development Margin is the maximum price for the land that the developer would pay to make the calculated development margin equal to the target hurdle rate. The target hurdle rate is essentially the developer’s required return for the project, also referred to as a ‘Profit and Risk Factor’. The Development Margin has been the traditional method of development feasibility analysis in the past and is beneficial for short-term projects.
However, it does have its shortcomings – it does not account for the time value of money and its results can be misleading for projects that extend beyond two or more years. Two projects may have the same net profit, but due to differences in the timing of cash inflows and outflows, one project may be realizing its profit earlier than the other.
Therefore, if you consider the adage “a bird in the hand is worth two in the bush”, then even though the projects have the same profit, a prudent developer/investor would choose the project that achieves its profit earlier.
Hurdle Rates
After taking into consideration the duration of the project to determine which RLV calculation to adopt, another important factor is the actual hurdle rate that is applied for the Target Development Margin and Target IRR.
These targets must be accurate and realistic, the Target IRR, which is sensitive to not only costs and revenues but also time. Quite simply, if a higher return is required (and thus a higher hurdle rate is adopted), the RLV function will indicate that you would have to pay less for the land to achieve that target, and vice versa. Failure to adopt the correct hurdle rate could result in a miscalculation of the land value and subsequently an incorrect land acquisition cost.
So, in summary, things to consider when adopting an RLV:
- The RLV based on the Development Margin is suitable for projects of approximately 2 years or less.
- Ensure that accurate hurdle rates are applied.
- If applying the RLV on IRR/NPV, ensure that the correct annual to rest period conversion is applied.
Chapter 3
Starting the Application
3. Starting the Application
3.1 Launching the Application
The entire Feasibility.pro software operates from a central launcher that is loaded from a single shortcut within Windows:
- Once loaded, you can select your installed applications, and it will display a list of files recently opened and saved by the user.
- There are also shortcuts to our extensive Sample File Library, Operations Manual, and Training Courses Booking page on our website.
- For those applications not yet installed on the machine, there is information to learn more about them and even links to download a free trial.
Starting Feasibility.pro

In Windows go to the [Start] > [Programs] > [Feasibility.pro] and click on ‘Feasibility.pro'
3.2 Product Tabs
The tabs for each Feasibility.pro software product will display different information, depending on whether it is installed on the active machine or not. To customize the experience for each user, each time the Application Launchpad is started, it will always revert to the last tab selected by that user on that machine.
Software is Installed
When the software is installed on the active machine, the following will be displayed on the product tab:
- A list of 'Recent Files' opened or saved by the active user (a list is stored for each user on the machine). To open one of these files, either double-click on it or select it to expand the file details and then click the [Open] button.
- A list of 'Sample Files' provided to demonstrate the use of the software in different scenarios. These are automatically sourced from our online Sample Files Library, so an internet connection is required for them to appear on the Application Launchpad and always be up to date with the latest samples.
- A Browse button to manually search for and open a Feasibility.pro HF file.
- A Run button to start the Feasibility.pro HF application with a blank new file.
- Links to view the Training Course online booking site and open the User Manual (PDF).
Chapter 4
4.1 Quick Start
- Run the Feasibility.pro (HF) program from the Feasibility.pro Application Launchpad.
- Open an existing Feasibility.pro HF data file (*.fphf) using the [File] > [Open] command or start inputting data to create a new data file.
- Set Preferences by running the 'Preferences' function from the Ribbon Menu (or by pressing [F2]).

- Navigate around the program by selecting the relevant worksheet tabs.
- Enter data into input cells with a font color of blue. Fixed cells (non-input) have a black font color. The worksheets are locked, so the program will only allow you to enter data into the relevant input cells.When data input is complete, you may run the Residual Land Value Analysis, Sensitivity Analysis, or Probability Analysis by clicking on the button on the relevant worksheets.When you are satisfied that the information has been entered correctly you may select the Printing Options on the Ribbon Menu to print the reports.
- Save your changes using the [File]>[Save/Save As] command on the Ribbon Menu.
4.2 Opening and Closing of File
Opening a New Feasibility.pro HF Data File
- Click [Run] in the Feasibility.pro HF tab of the Application Launchpad.
- Use the [New] command to load a new blank workbook window.
Opening an Existing Feasibility.pro HF Data File
Open an existing Feasibility.pro HF data file (*.fphf) either by:
- Double-click a file in the 'Recent Files' list or click [Browse] to find another file, in the Feasibility.pro HF tab of the Application Launchpad.
- Using the [Open] command to browse to and open the file. You can also open Feasibility.pro HF Lite files (*.fphf) with this method.
- Browsing Windows Explorer and double-clicking on a data file to open it.
Saving and Closing an Feasibility.pro HF Data File
- After using the program, save the file if required by one of many different buttons on the Toolbar. Please note that some of the fields on the 'Intro' and 'Input' sheets are mandatory, and you will not be able to save a file if they haven't been entered.
- If you have elected to save files with a password in the application settings, then it will prompt you to enter the password and confirm it before saving.
Exiting from Feasibility.pro HF
When finished, close the application either by:
- clicking on [X] in the top right corner of the application window,
- double clicking the Feasibility.pro HF icon in the top left corner or
- selecting [Exit] from the Application Menu.
4.3 Navigation
The Feasibility.pro HF program is subdivided into a series of worksheets. To navigate around the Feasibility.pro HF program, click on the relevant worksheet tabs (below or above workbook area).

Intro Introduction page. Enter the project name and other details.
Input Primary data input sheet. This is where most assumptions regarding costs and revenues are entered. The Gantt chart for viewing project timeline is also generated on this sheet.
P&L Op Contains details on EBITDA from the operations of the Hotel. Input for calculation has to be in the input sheet.
P&L Sold Contains details on EBITDA based on the number of keys sold in the Hotel. Input for calculation has to be in the input sheet.
Cash Flow Contains the detailed cash flow outputs. This is where optional manual cash flow inputs can also be entered.
Summary 'Provides the user with a break-up of all the costs, revenues, and KPIs at a summary level.
Charts Project cash flow charts for Revenue and cost and other charts.
Financials Profit and Loss and Balance Sheet reporting.
Option Summary Consolidates or compares up to 8 different stages or options that have been stored!
Sensitivity The tables from the Sensitivity Analysis.
Profiles The sheet for the Development data, S-curve profiles, and revenue collection profiles
4.4 Keywords Shortcut
The following are some keyboard shortcuts to assist in navigation, data entry and working with cells and worksheets.
| File Operation | |
| Ctrl + N | Creates a blank workbook |
| Ctrl + O | Invokes the open dialog box |
| Ctrl + S | Save changes in the current workbook |
| Navigation | |
| Left Arrow key | Move the active cell one cell to the left in the worksheet |
| Right Arow Key | Move the active cell one cell to the right in the worksheet |
| Up Arrow Key | Move the active cell one cell up in the worksheet |
| Down Arrow Key | Move the active cell one cell the down in the worksheet |
| Enter | Move the active cell one cell to the down in the worksheet |
| Shift + Enter | Move the active cell one cell to the up in the worksheet |
| Tab | Move the active cell one cell to the right in the worksheet |
| Shift + Tab | Move the active cell one cell to the left in the worksheet |
| Ctrl + Arrow Keys | Move the active cell to the edge of the current data region in the worksheet |
| End, Arrow Key | Press END to turn End Mode on and use an arrow key to move to the first or last cell of a data range in the row or column. If cells are blank, the active cell moves to the first or last cell in the row or column. End Mode turns off after you press an arrow key. Press END to activate End Mode again. |
| Ctrl + Home | Moves the active cell to the beginning of a worksheet |
| Ctrl + End | Moves the active cell to the last cell in a worksheet (the last edited row of the rightmost edited column). |
| Home | Moves the active cell to the beginning of a row in a worksheet |
| Page Down | Moves the active cell one screen down in a worksheet |
| Page Up | Moves the active cell one screen up in a worksheet |
| Alt + Page Down | Moves the active cell one screen to the right in a worksheet |
| Alt + Page Up | Moves the active cell one screen to the left in a worksheet |
| Ctrl + F | Invokes the Find and Replace dialog (with the Find tab activated). |
| Ctrl + H | Invokes the Find and Replace dialog (with the Replace tab activated). |
| Ctrl + Page Down | Moves to the next worksheet in the current workbook. |
| Ctrl + Page Up | Moves to the previous worksheet in the current workbook. |
| Working With Selection | |
| Enter | Moves the active cell one cell down in the selection. |
| Shift + Enter | Moves the active cell one cell up in the selection. |
| Tab | Moves the active cell one cell to the right in the selection. |
| Shift + Tab | Moves the active cell one cell to the left in the selection. |
| Ctrl + Spacebar | Selects an entire column in a worksheet. |
| Shift + Spacebar | Selects an entire row in a worksheet. |
| Ctrl + A | Selects the entire worksheet or the data region to which the active cell belongs. |
| Ctrl + Shift + Spacebar | Selects the entire worksheet or the data region to which the active cell belongs. |
| Shift + Arrow Keys | Extend the selection by one cell. |
| Ctrl + Shift + Arrow Keys | Extend the selection to the last nonblank cell in a row or column. |
| Shift + Home | Extends the selection to the first column. |
| Ctrl + Shift + Home | Extends the selection to the beginning of the document. |
| Ctrl + Shift + End | Extends the selection to the previously used cell in a worksheet. |
| Shift + Page Down | Extends the selection one screen down in a worksheet. |
| Shift + Page Up | Extends the selection one screen up in a worksheet. |
| Cell Formatting | |
| CTRL+B | Applies or removes bold formatting. |
| CTRL+I | Applies or removes italic formatting. |
| CTRL+U | Applies or removes underlining. |
| Working with Columns & Rows | |
| Alt + Shift + Right Arrow Key | Groups the selected rows or columns. |
| Alt + Shift + Left Arrow Key | Ungroups the selected rows or columns. |
4.5 Menus and Tool Bars
There are 4 main menus and toolbars in the Feasibility.pro HF application for the user:
- The Ribbon Menu
- The Application Menu
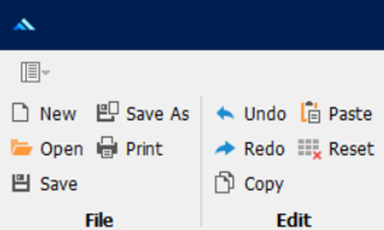
4.5.1 Ribbon Menu
The Ribbon Menu is located at the top of the application window and provides the user with the functions available in the program, and in particular, the functions related to specific sheets.

The Ribbon Menu has 2 definable parts:
- Functions that apply to all worksheets:
- These are common functions that can be used on all worksheets and are replicated on all worksheet tabs.
- If any of these functions are greyed out (disabled), then they do not apply to the active worksheet.
- Functions that apply to the currently selected worksheet:
- These appear when a different tab/worksheet is selected.
- They are identified by an aqua-colored menu button.
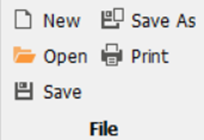
File Menu
New Opens a Feasibility.pro HF blank workbook in a new window.
Open Prompts the user to open an existing Feasibility.pro HF data file (*.fphf) in a new window.
Save Saves the current Feasibility.pro HF model to a data file. 'Saving' a file is different to 'exporting' it to the Feasibility.pro Database .
Save As Saves the current Feasibility.pro HF model to a data file with a new file name.
Print Loads the Feasibility.pro HF Print Menu to allow the user to select what reports to print.
Close File Closes the current Feasibility.pro HF model window.
Edit Menu
Undo Undo the last action.
Redo Redo the last action.
Copy Copy the selected range to the clipboard.
Paste Pastes the contents of the clipboard into the selected range. When the active sheet is a standard sheet, then only values are pasted.
Reset This will clear all the inputs in the standard worksheets to the default. It will not remove user-inserted worksheets. In addition, it allows the user to reset to default or manual variations in interest rates, loan drawdowns or repayments, and variable discount rate inputs made on the Cash Flow sheet. Do we have this function?
Tools Menu
Preferences Opens the form for the user to select their data Preferences. These should be set before any data is entered but can be changed at any time.
Goal Seek This is an analysis feature that finds the value for a selected cell that would produce a given result from a calculation. Refer to 'Goal Seek' section for more information.
Options Runs the Store/Recall function. Store the current set of inputs as one of the eight available 'options' in the program for comparison or consolidation purposes. Recall one of the 'options' in the program back into the main input sheet for editing.
Office Links Menu
Excel Loads the dialog where you can create and edit links to external Excel files.
Refresh Updates the values for all linked Excel and Word files.
Sheets Menu
Add Add a custom worksheet to the workbook.
Rename Rename the currently selected custom worksheet.
Delete Delete the currently selected custom worksheet.
Move Rearrange the order of the custom worksheets.
Hide/Unhide Change the visibility of the custom worksheets.
Tab Color Change the tab color of the custom worksheets from the default.
Protect / Unprotect Protect or unprotect the selected worksheet. When protecting, you will be prompted to enter in a password. If this is left blank, the worksheet will still be protected, but with no password.)
Data Menu
Export to Database Export Feasibility.pro HF input data to the Feasibility.pro Database. This is different to 'saving' an Feasibility.pro HF data file (*.fphf)
Export to Excel Export the entire file to Excel, either as a standalone file or appended to an existing file.
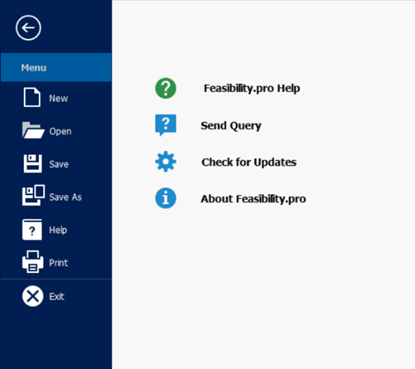
4.5.2 Application Menu
The Application Menu is in the top-left corner of the application window (indicated by the Feasibility.pro HF icon) and provides the user with access to the various File functions available in the program, as well as the application settings and the Help features.
Spreadsheet Display Hide or show the row and column headers on the standard worksheets. For custom worksheets, you can use the context menu to toggle the row and column headers on each one
Saving : Save with “Save/Save As” Tool
Export to Database Set the software to always prompt the user to store the data in the .csv & .xml when storing.
| Feasibility.pro HF Help | Opens the Feasibility.pro HF Help program on the web. |
| Send Query | Send a technical support query via email/internet |
| Check for Updates | Check the latest version of the software online (requires an internet connection). |
| About Feasibility.pro HF | Allows the user to view the current license details and re-register an existing license. |
4.5.4 Sheet Context Menus
Context Menus pop up when clicking an item on the worksheet area, offering a list of options which vary depending on the item selected. These menus are invoked with a right-click of a mouse.
User Inserted Sheets
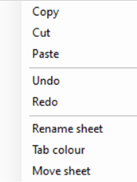
The context menu on the User Inserted sheets is invoked by right clicking a cell, row or column.
| Copy | Copies the currently selected range of cells to the clipboard. |
| Cut | Cuts the currently selected range of cells to the clipboard. |
| Paste | Pastes the content of the clipboard in the currently selected range. When the active sheet is a standard sheet, then only values are pasted. |
| Insert | Inserts a column or row next to the currently selected range. |
| Delete | Deletes the currently selected column or row. |
4.6 Status Bars
The Status Bar is located at the bottom of the application. It has the following definable parts:
- Options Status: This part of the status bar alerts the user what the last Option was either recalled or stored as.

4.7 Goal Seek
Goal Seek is sometimes called what-if analysis. When you know the desired result of a single formula but not the input value the formula needs to determine the result, you can use the Goal Seek feature available by clicking on the Ribbon Menu.
When goal seeking, the program varies the value in one specific cell until a formula that's dependent on that cell returns the result you want.
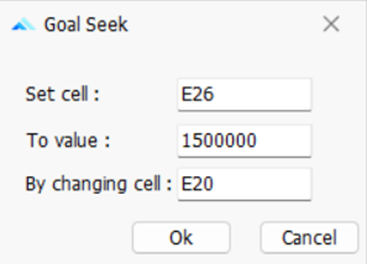
- Set Cell: The cell that contains the formula that you want to settle/resolve. That cell must always contain a formula or a function, not a value.
- To Value: The value you want the formula (in the Set Cell) to change to.
- By Changing Cell: The part of the formula that you wish to change. That cell must contain a value only, not a formula or function.
4.8 Resizing the Model
The Feasibility.pro HF model can be resized in two areas:
- Adding more time periods (45 to 360) Please check
- Adding more cost and revenue rows (5 to 150, depending on section).
Resize Time Periods
Resizing the time periods is controlled via the Preferences.

- Go the Ribbon Menu and click on or just press F2.
- Go to the 'Cash Flow Periods' tab.
- Expand or reduce the number of time periods. Only add what you need as it will impact on the size of the file.
- Click on OK and it will make the appropriate changes to the file.
Resize Cost/Revenue Rows
Resizing the input rows is controlled via the Ribbon Menu when the Input [NJ1] [Ma2] is selected.
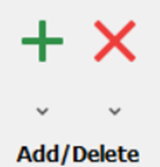
Inserting Rows:
- Click on the Input Rows 'Add' button and select from the list which section you would like to add rows to.
- The program will then prompt how many rows you would like to insert - up to 50 at a time and 150 in some cases
- Click OK to the number, and the model will then resize, adding rows to the end of the section (above the last row).
Deleting Rows:
- Click on the Input Rows 'Delete' button and select from the list which section you would like to add rows to.
- Click OK, and the model will then delete the rows from the end of the section (above the last row- the last row does not get deleted).
- If these rows have any data in them, it will delete these rows, so please check before deleting them.
4.8 Exporting to Excel
Since Feasibility.pro HF is built on a spreadsheet user interface, you can export the entire file to Excel, allowing you to use that file and its data in any way you require. To export the file, go to the Ribbon Menu and click on [Data] > [Export to Excel]
Chapter 5
5. Preferences
The program allows flexibility by the way of user preferences. These are operated by:
- Clicking on [Preference on the Ribbon Menu or Quick Access Toolbar,
- Pressing the [F2] key.
Printing an Assumptions Report
To check what preferences and settings have been defined in the model, preference sheet is available to be printed in the Print Menu.
General
5.1.1 Regional Settings
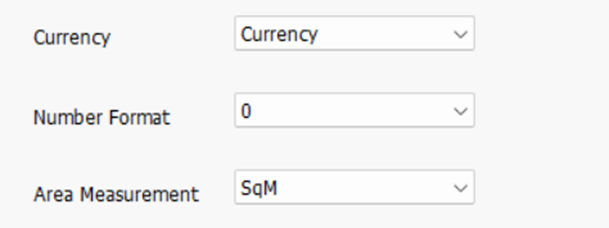
Currency : Set the currency format. This is important if the Feasibility.pro software is used to consolidate cash flows that are based on different currencies.
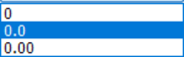
Input Number Formats: Select the number of decimal places for the input cells.
5.1.2 Cash Flow Periods

Cash Flow Period: Nominate the periods for the cash flow. This option will determine how the Start and Span dates are to be entered and how the cash flow will be displayed.

Changing the rest period after you have started a model will not affect any existing values for Start and Span dates for individual cost and revenue items.
For example, say you change 'Monthly' to 'Quarterly' rests - a cost item that started Month 4 and spanned 3 months will now start Quarter 4 and span 3 quarters, so it will need to be manually updated by the user to start Quarter 1 and span 1 quarter.
We are not using “rest” and our definition of span is different, please check and correct.
Resize Time Periods : Increase or decrease the number of timer periods in the model to suit user preference (1 to 240).
Resize Time Periods(hotels) : Increase or decrease the number of timer periods in the model to suit user preference (1 to 180).
Financial Year End Month : The start month of the project is considered the 1st month and hence the financial year will be 12 months from the start month.
IRR/NPV Calculation : The IRR and NPV calculations for each period is to be calculated from the Start of Project
5.1.3 Spreadsheet Display
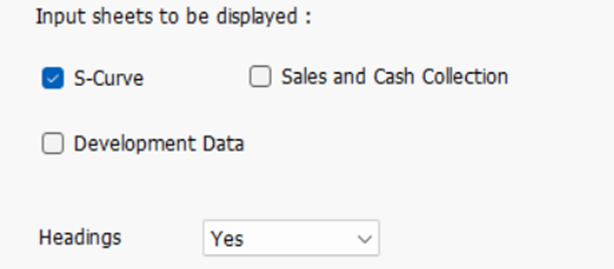
Input Sheets and Report Sheets to Display:
Select the worksheets which are to be displayed. Deselect to hide worksheets that you are not working on or do not intend to display, making navigation around the workbook a little easier. Hiding sheets does not impede the operation of the program.
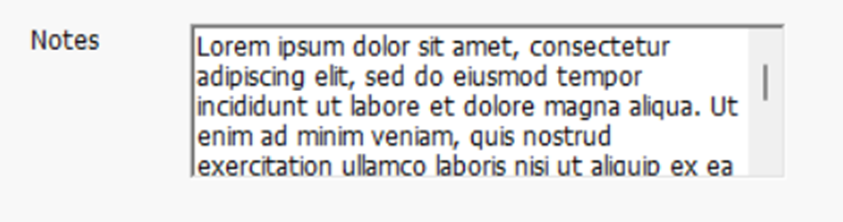
5.1.4 Notes
Notes on Summary Page: Enter the text, if applicable, for any note to be displayed on the Summary pages. The maximum characters allowed are 2,500.
5.1.5 Logos
Corporate Logo and Property Photo
Insert your own corporate logo on the report sheets and insert a photo/image of the subject property/project on the Summary sheet.

- Only jpeg and bmp files can be inserted.
- There are no file/image size restrictions.
- The program will automatically downscale the image if it is too large to fit in the allocated area.
- If the image is smaller than the allocated, it will not be upscaled to avoid distortion.
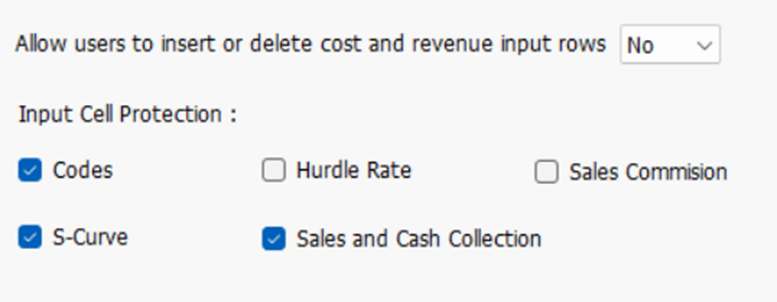
5.1.6 Protection
Insert/Delete Input Rows: Enable the user to insert/delete rows on the Cash Flow sheet.
Input Cell Protection: This allows you to Lock various input cells throughout the program. Once this is done, the input cell will change to a 'black' font and a warning will appear on the status bar to indicate the active sheet has locked input cells.
Release from Escrow
An Escrow account is a temporary account that holds money or assets until certain conditions are met. The funds can be used only after they have fulfilled the escrow agreement/conditions. There is a legal responsibility of the Developer to maintain ESCROW Retention as specified in the Law.
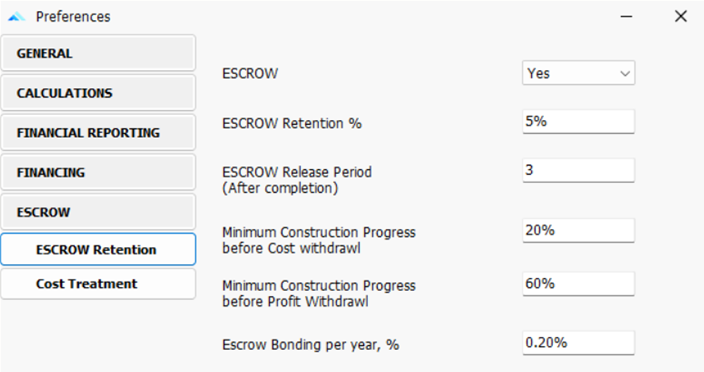
ESCROW Retention: defines the % of cash inflows from unit sales that must be retained in the Escrow account in compliance with applicable law.
ESCROW Release Period: Input to specify number of periods/years for which funds will be held in ESCROW account even after completion of the construction.
Minimum Construction Progress
These parameters define the minimum construction progress thresholds required before withdrawals from the escrow account are permitted:
| Cost Withdrawal Minimum construction progress required to withdraw funds for construction-related costs. | Profit Withdrawal Minimum construction progress required to withdraw funds as profit from the business. |
ESCROW Bonding: During the construction phase, funds retained in escrow are often offset through Escrow Bonding, under which a nearly equivalent amount is financed by a bank to ensure uninterrupted construction progress.
The bank charges interest for this financing service, represented as Escrow Bonding % per year.
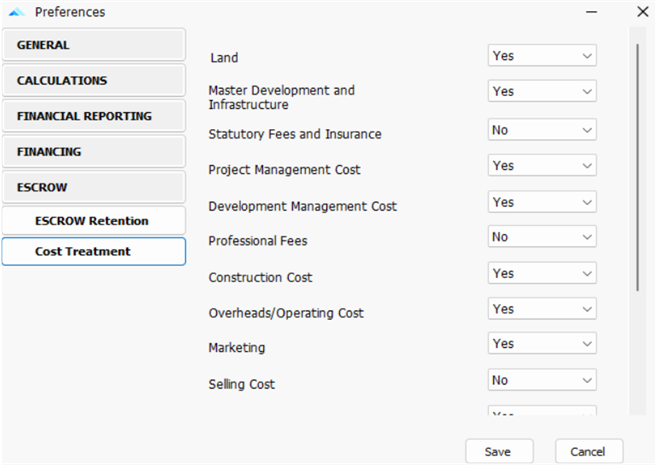
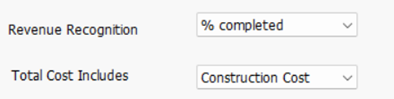
Cost Treatment Options: Cost Treatment settings define which cost components are considered as construction costs for Escrow calculations. These costs are used to determine eligibility for holding or releasing funds from the Escrow account.
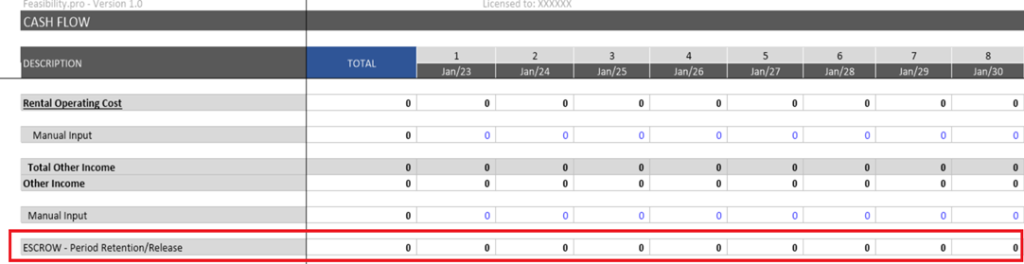
Release of Escrow Funds: Funds held in the escrow account are released only after:
1. Completion of construction, and
2. Expiry of the user-defined Escrow Release Period after construction completion.
Linked to Construction Start: Revenue collection is potentially delayed based on the number of time periods (e.g. Months) after Construction Start (i.e., the earliest construction cost). When this option is selected, a new set of inputs appears at the bottom of the Sales Revenue Collection Profile input table.
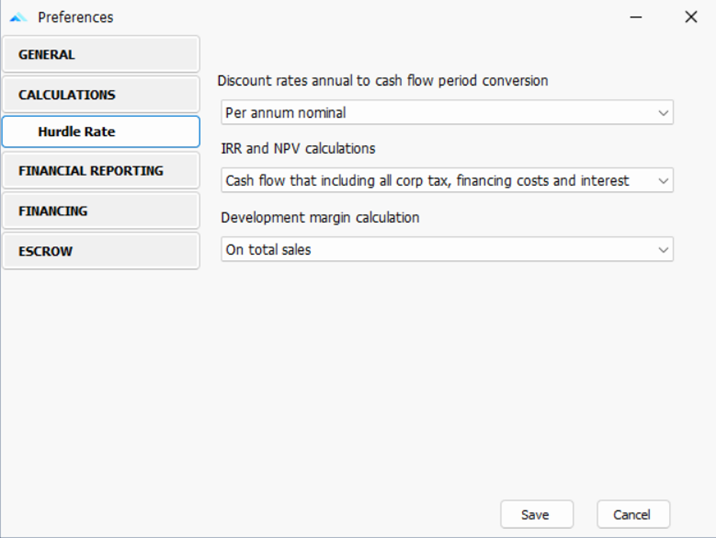
5.1.7 Hurdle Rates
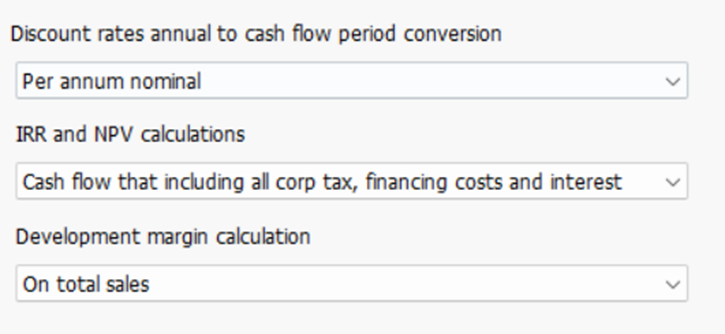
Discount Rate Conversion : This enables you to select the applicability of the Annual discount rate on a Nominal and Effective basis.
The difference is given in the following formulae:
| Nominal Conversion | D/T |
| Effective Conversion | [(D + 1)1/T]-1 |
Where:
D = is the annual discount rate.
T = The number of rest periods per annum (i.e. Monthly = 12)
IRR and NPV Calculation: Nominate if Finance Costs, Interest Charges, or Corporate Tax are to be included in the calculation of the Project IRR and NPV.
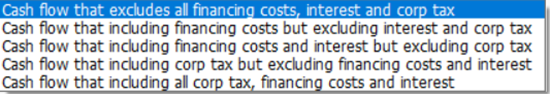
- Financing Costs = Cost defined in the 'Financing Costs' section and Fees (e.g., Application, Line, and Standby) associated with each loan.
- Interest = Interest charged on equity or the loan facilities.
- Corp Tax = Corporate Tax on project profit that is applied on the Financials sheet (manual input).
| Development Margin Calculation | Nominate what forms the basis for calculating the development margin.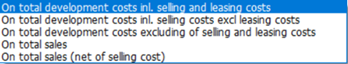 |
The following defines the exact components of the Summary Report that are used in the calculation of each option:
|
5.2 Financial Reporting
5.2.1 Financial Reporting

Financial Reporting: To enable Profit & Loss Statements, Balance Sheet, Corporate
click on the Enable Reporting option.
5.2.2 Revenue Treatment
14.1 Revenue Recognition
| DESCRIPTION | TOTAL | 1 | 2 | 3 |
| Mar/23 | Apr/23 | May/23 | ||
| Revenue Recognition Calculation | ||||
| Sales | 0 | 0 | 0 | 0 |
| Cumulative Sales | 0 | 0 | 0 | |
| Land Costs | 0 | 0 | 0 | 0 |
| Construction Costs | 0 | 0 | 0 | 0 |
| Total Costs | 0 | 0 | 0 | 0 |
| Revenue Recognition % | 0.0% | 0.0% | 0.0% | |
| Period Revenue Recognition | 0 | 0 | 0 | 0 |
Above Calculation shows % and amount of Sales/Revenue to be recognized for each period. Depending on the % of cumulative total cost till the respective period, Revenue recognition % is calculated.
5.1.1 Cost Treatment
| DESCRIPTION | TOTAL | 1 | 2 | 3 |
| Mar/23 | Apr/23 | May/23 | ||
| Development Costs for WIP Calculation | ||||
| Land | 0 | 0 | 0 | 0 |
| Master Development & Infrastructure | 0 | 0 | 0 | 0 |
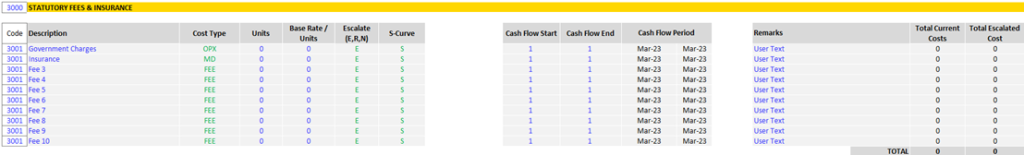
| Statutory Fees & Insurance | 0 | 0 | 0 | 0 |
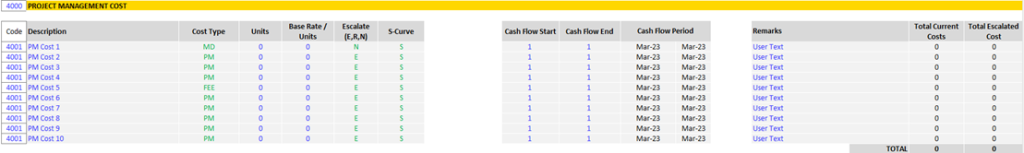
| Project Management Cost | 0 | 0 | 0 | 0 |
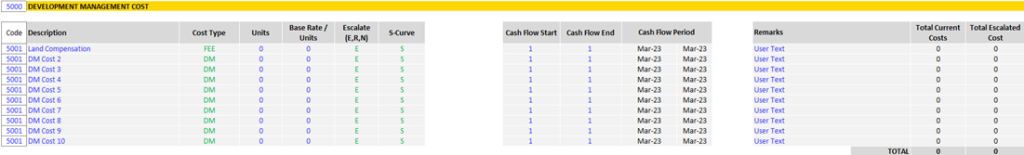
| Development Management Cost | 0 | 0 | 0 | 0 |
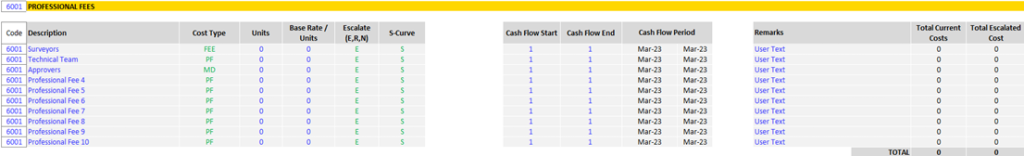
| Professional Fees | 0 | 0 | 0 | 0 |
| Technical Service Fees | 0 | 0 | 0 | 0 |
| FF&E | 0 | 0 | 0 | 0 |
| OS&E | 0 | 0 | 0 | 0 |
| Pre-Opening Cost | 0 | 0 | 0 | 0 |
| Construction Cost | 0 | 0 | 0 | 0 |
| Overheads /Asset Management Fees | 0 | 0 | 0 | 0 |
| Marketing | 0 | 0 | 0 | 0 |
| Selling Cost | 0 | 0 | 0 | 0 |
| Contingencies | 0 | 0 | 0 | 0 |
| Interest Expenses | 0 | 0 | 0 | 0 |
| Misc. Cost | 0 | 0 | 0 | 0 |
| Total Development Costs Incurred (WIP) | 0 | 0 | 0 | 0 |
| Other Costs | ||||
| Other Land Acquisition (WIP) | 0 | 0 | 0 | 0 |
| Other Selling Costs (WIP) | 0 | 0 | 0 | 0 |
| Other Financing Costs (WIP) | 0 | 0 | 0 | 0 |
| Finance Application, Line & Standby Fees (WIP) | 0 | 0 | 0 | 0 |
| Total Other Costs (WIP) | 0 | 0 | 0 | 0 |
The above Tables shows breakdown of all costs, showing how each is treated i.e., either directly Expenses through P&L or Work in Progress.
| DESCRIPTION | TOTAL | 1 | 2 | 3 |
| Mar/23 | Apr/23 | May/23 | ||
| Total Cost (WIP) | 0 | 0 | 0 | 0 |
| Directly Expensed through P&L | 41,649 | 0 | 0 | 0 |
| Going through to WIP | 0 | 0 | 0 | 0 |
| Test: Current Projected Total Cost, (through P&L) | 41,649 | 0 | 0 | 0 |
Summary of total costs, grouped by Expensed and WIP (Work in Progress).
Costs for WIP Calculation
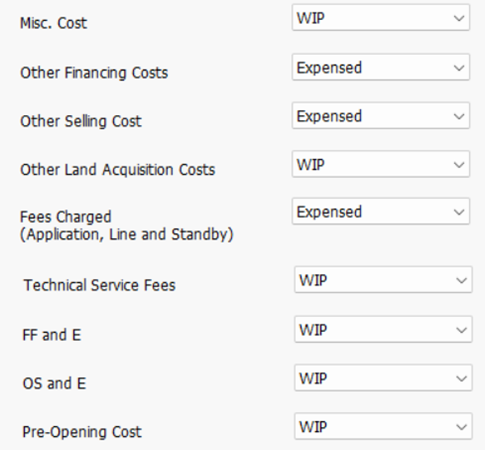
This section summarizes all the costs in the development and determines if they are treated as Work In Progress or Expensed as selected in the Preference.

Expensed: Directly expense the cost on the date it is incurred in the 'Cost of Sales' section of the Profit and Loss statement, impacting how the Project Margin is calculated.
WIP: Add Cost to “Work in Progress”. This defers the recognition of the costs in the Profit and Loss statement during the period in which it is incurred. These costs appear as ’Current Assets’ on the Balance Sheet called 'Work in Progress'.
These Costs are gradually transferred to the P&L over time as revenue is recognized from the sales. Once 100% of the revenue has been recognized, the entire WIP expense amount will also have been written off in the P&L.
In other words, WIP expense is a way of matching the costs of construction/development with the revenue generated from the sales.
Treatment for Land is also similar and the option of choosing it as “Expensed” or treating it as “WIP” is included in the preference.

5.1 Financing
5.1.1 Global Settings
Financing Level
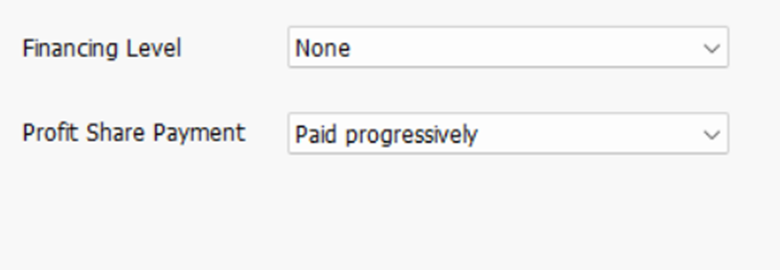
This option allows the user to toggle between two finance layouts:
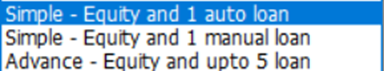
Simple: Use Equity and Senior Loan only. When clicked it resets and hides the other Loans 1 to 4 from the input and output sheets.
Advance: Use the button to set all the number of funding facilities – Equity & 5 Loans
- Understanding Interest Rate – Nominal and Effective
Nominal interest rate is the interest rate that is quoted or advertised. It is the stated interest rate on a loan or investment, and it does not consider the compounding period.
Effective interest rate is the actual interest rate that is earned on a loan or investment, considering the compounding period. The compounding period is the number of times per year that interest is earned on interest.
Imagine that you invest $100 at a nominal interest rate of 10% compounded annually. This means that you will earn $10 in interest each year.
Now, imagine that the interest is compounded semiannually. This means that you will earn $5 in interest every six months. However, you will also earn interest on the interest that you have already earned.
As a result, your effective interest rate will be slightly higher than 10%.
The following table shows the difference between nominal and effective interest rates for different compounding periods:
| Compounding period | Nominal interest rate | Effective interest rate |
| Annually | 10% | 10% |
| Semi-annually | 10% | 10.25% |
| Quarterly | 10% | 10.38% |
| Monthly | 10% | 10.47% |
As you can see, the more often the interest is compounded, the higher the effective interest rate will be.
FINANCING – EQUITY & DEBT
1. Loan + 2. Equity + Equity dropdown methods
Loans (DEBT)
There are two types of Loans:
- Auto Loans
- Manual Loans
- Auto Loans (Loan 1 and Loan 2)
- Auto Loan will be automatically raised by the amount required in the respective period. Auto Loans are assumed to be available from the commencement of the project (i.e., the first period itself). The maturity period for Auto loans is manually specified.
- The amount is raised at the beginning of the respective period.
- Auto Loan 1 is used first. Once it hits the limit and there is still requirement of funds not met, only then Auto Loan 2 will be used (before raising any amount from Auto Loan 2 facility, maximum limit of auto loan must be exhausted).
- Manual Loans (Loan 3, Loan 4 and Loan 5)
- Manual Loan will be raised as per period and Loan amount entered on the Input sheet.
Explanation of Input Options on the Input Screen:
- Loan 1 (Auto)
- Auto Injection Limit: It is the maximum (cumulative) limit up to which Loan 1 can be raised. Beyond the limit, Loan 2 will be triggered to fulfil the additional funding requirement.
- Maturity Period: Maturity period is manually entered. Repayment of Loan is made in equal instalments starting from present period till the Maturity Period manually entered here.
- Loan 2 (Auto)
- Auto Injection Limit: It is the maximum limit beyond which Loan 2 cannot fulfil the additional requirement.
- Loan 3, Loan 4 & Loan 5 (Manual Loan)
- Period Commencement: Period Commencement is decided manually here i.e. It is fully raised in the Period of commencement of Loan entered here regardless of the need in the chosen period.
- Maturity Period: Maturity period is also manually entered. Repayment of Loan is made in equal instalments starting from present period till the Maturity Period.
Equity
| Developer's Equity Contribution | Limit |
| Injected in Total upfront: | 5,000,000 |
| Auto Injection Limit | 4,500,000 |
| Equity Option | Inject when required |
| Repayment | Repaid when available |
- Injected in Total upfront: amount injected at period 1.
- Auto Injection Limit: This is the maximum limit for the cumulative amount that would be injected only when required in any respective period.
- Equity Options: Option to select whether equity is to be injected upfront or to be injected when required.
- Repayment: This option is for selection of Equity repayment method. Equity can either be repaid:
- whenever the excess balance is available in any period or
- at the end of the project i.e., in the last period.
- Profit Share Payment: This option is for the selection of payment method of profit. Profit can either be paid:
- whenever excess balance is available in any period or
- at the end of the project i.e., in the last period.
Chapter 6
6. INPUT ASSUMPTIONS
6.1 Set Preferences
It is recommended that before entering any data in the 'Input' sheet, the user set their preferences. This can be done by:
- Clicking on Preferences on the Ribbon Menu.
- Pressing the [F2] key.
6.2 Inputting Data
Input Cell Types
Enter data into input cells with a font color of blue or green. Fixed cells (non-input) have a black font color. Since the worksheets are protected and locked, the model will only allow you to enter the relevant input cells.
Blue Font Cells: Cells with blue font are the main input cells in the program.
Period Start and Span
For every payment and revenue, it is necessary to put a start date and span period, or else the program will not add the payment to the cash flow.
The Start Date must be a number between one (1) (which represents the first or current period).
- The Span Period must be greater than but not equal to zero.
- The start or end period must not be more than the maximum time period in the model - or else you will exceed the program's limits.
6.4 Cost Codes
1. Manually type in the Cost Code, in the ‘Code’ input field of the Feasibility.pro HF file
2. Manually type in the Cost Code Description, in the ‘Description’ input field of the Feasibility.pro HF file.
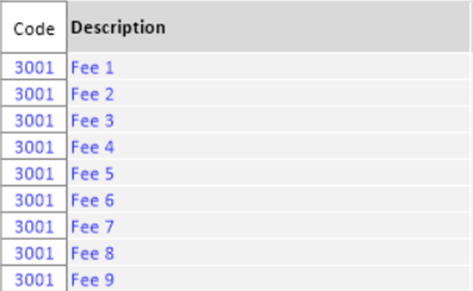
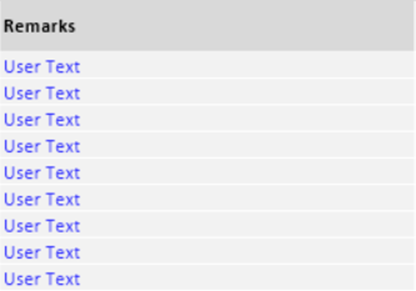
Remarks
Once a Cost Code and Description has been applied to a line item, narration/details as per the user can be put under the “Remarks” Column.
6.5 BASIC INPUT
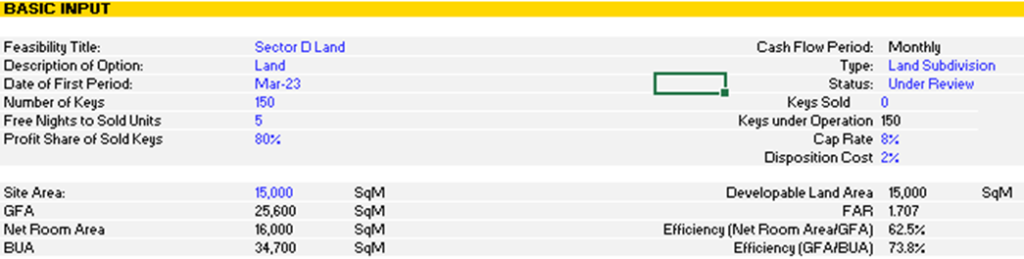
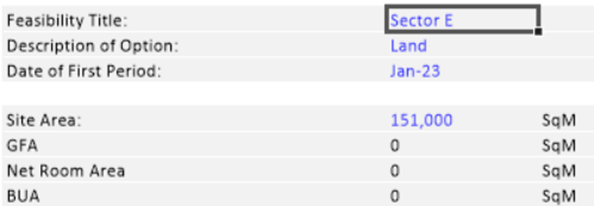
| Title (Mandatory) | Enter the Feasibility Title of the project that the hotel property belongs to. |
| Description of Option (Mandatory) | Enter the description of the option. |
| Date of First Period (Mandatory) | Enter the date of the first period in the cash flow. The first period is time period One (1). |
| Cash Flow Rest Period | The cash flow rest period (monthly, quarterly, or yearly) is set using the Preferences |
| Number of Keys | Enter the total number of hotel rooms available in the project available in the project |
| Keys Sold | Enter the number of rooms sold and available for leasing out and revenue generation. |
| Profit Share of Sold Keys | Mention the profit % to be kept out from the Cash Flow |
| Cap Rate | Indicate the capitalization rate credits the project with a terminal or residual value (i.e. sale revenue) at the end of the Hotel lease period. |
| Disposition Cost | % cost on the disposition. |
| Enter Project Size (Optional) | Project size relates to the size of site area, developable land area, GFA, FAR, BUA etc. You may enter any type of measurement to summarize the development. These do not affect the cash flow and are only used for reporting purposes on the' Summary' sheet., |
6.6 Land Purchase and Acquisition Costs
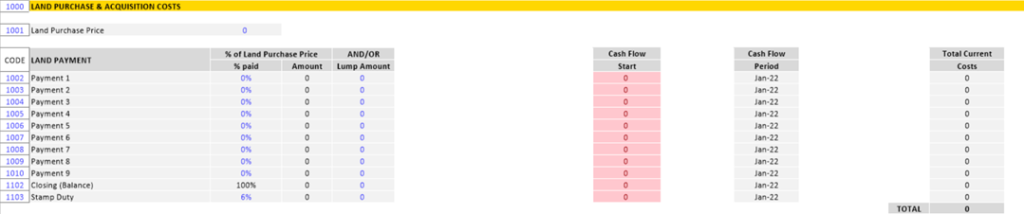
| Land Purchase Price (Optional) | Input the land purchase price in the second input item. It is necessary to input a land purchase price, % paid, and the cash flow period in order to determine the amount. |
| Land Payments (Optional) | You can punch in your land acquisition payments - deposit either as a percentage and/or an amount and also the cash flow period of payment against the purchase. |
| Stamp Duty (Optional) | The automatic stamp duty is calculated for the total purchase price based on the % rate allocated by the user. |
Other Acquisition Costs
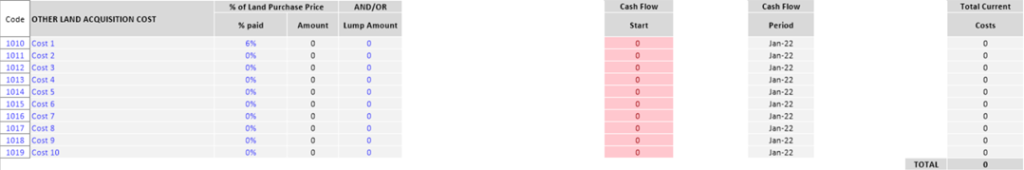
| % Paid and Lump Amount (Optional) | For other acquisition costs, such as legal fees, survey costs, etc., you may elect to either enter: ·A percentage of the land's purchase price, and/or ·A lumpsum amount. |
| Start (Mandatory) | For each item starting period, you have the following options: · Enter a number to nominate the start period manually |
6.7 Cost Escalation Rates
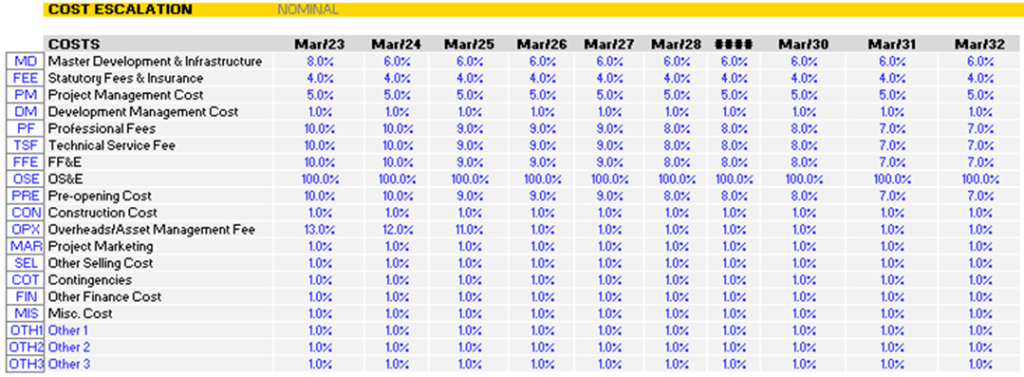
Escalation Rates can be defined for different categories of costs in the escalation table. These categories can be manually defined by the user by setting a 3-character code and a short description. Escalation rates can be set up as below:
- On a Periodic Compounded Escalation basis (e.g. 5% per annum, which equates to 0.41% compounded monthly).
- As a Positive (inflation) or negative (deflation) percentage.
Application of Escalation Rates for Costs
The method of application of escalation can vary for each cost item. Below is the method of applying escalation rates.
E = Escalates the cost to its start date.
R = Escalates the cost to its start date and continues the escalation through the span period; and
N = Does not apply escalation (this is the default if you leave the escalation input blank).
Escalation Examples
Say there is a $60,000 cost that starts in month 4 and has a 6-month duration and escalates 5% per annum. Using the different methods of escalation, the following cash flows would be created:
| Current Amount | Month Start | Month Span | Current Amount (per Month) |
| 60,000 | 4 | 6 | 10,000 |
| Month 0 | Month 1 | Month 2 | Month 3 | Month 4 | Month 5 | Month 6 | Month 7 | Month 8 | Month 9 |
| 5% | 5% | 5% | 5% | 5% | 5% | 5% | 5% | 5% | 5% |
| Escalation Factor Compounded Monthly (= Previous Months Escalation Factor x (1+5%)(1/12)) | |||||||||
| 100.00% | 100.41% | 100.82% | 101.23% | 101.64% | 102.05% | 102.47% | 102.89% | 103.31% | 103.73% |
| Code | Month 4 | Month 5 | Month 6 | Month 7 | Month 8 | Month 9 | Total |
| N | 10,000 | 10,000 | 10,000 | 10,000 | 10,000 | 10,000 | 60,000 |
| E | 10,164 | 10,164 | 10,164 | 10,164 | 10,164 | 10,164 | 60,984 |
| R | 10,164 | 10,205 | 10,247 | 10,289 | 10,331 | 10,373 | 61,608 |
- When "E" is selected, the Month 4 Escalation Factor (101.64%) is applied to the non-escalated amount per month (10,000) for the entire span.
- When "R" is selected, the Month 4 - 9 Escalation Factors are applied to the non-escalated monthly amount (10,000) for that specific month.
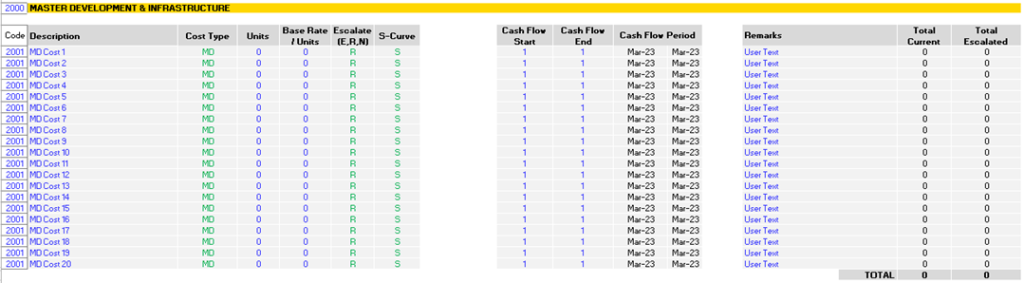
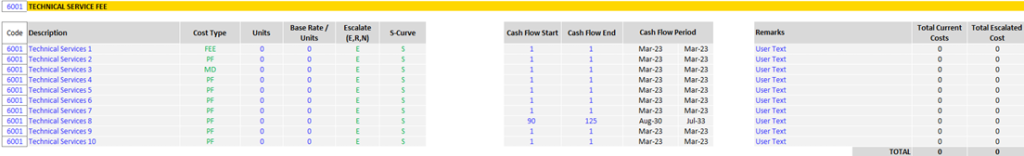
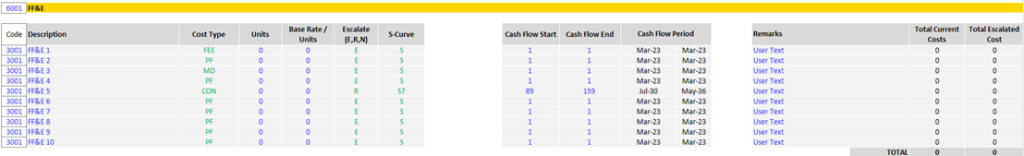
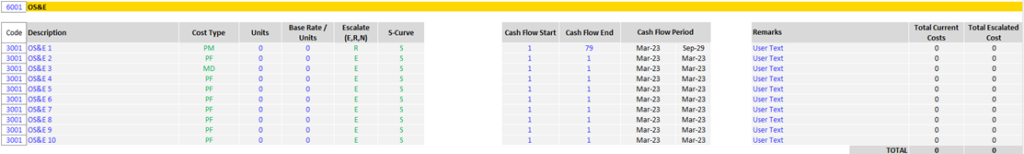
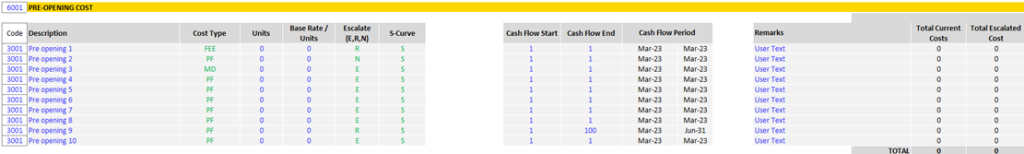
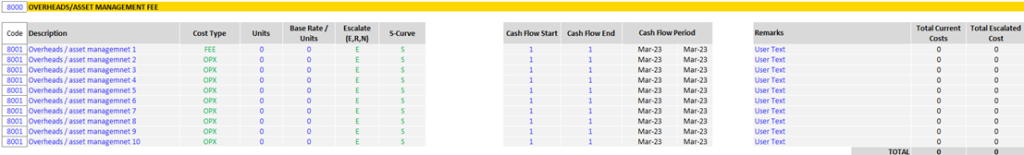
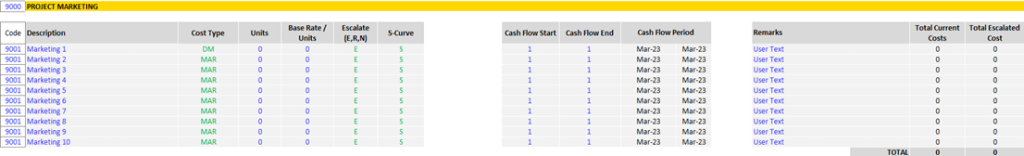
6.9 Parameters to the Costs
| Cost Type | The cost type is the 3-letter code used to identify the cost. You can select any of the costs with the corresponding escalation. |
| % of Construction and/or Amount (Mandatory) | For each cost item, it is mandatory to input, the number of units (e.g. sqm) and base rate per unit (e.g. $/sqm). If you do not input a number in the 'number of units' cell, the program will interpret the number as being zero (0) and consequently the cost will not be included in the cash flow. If you choose to enter the cost as a % of another cost this will not apply. |
| Escalation (Optional) | You may elect to apply escalation on any cost items. Enter "E" to escalate to start, orEnter "R" to escalate to start and continue escalation through span period, orLeave blank or enter "N" to assume the cost is fixed, hence no escalation. |
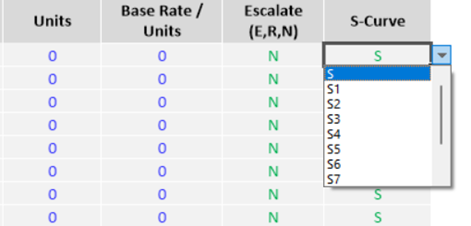
| S-Curve (Optional) | You may elect to span the cost payments evenly through the span period or apply a cumulative S-shape curve. Enter one of the codes (S, S1 to S10) for the 11-client customizable S-Curves. You can modify the S-curve profiles in the 'S Curve' tab. |
| Start and Span (Mandatory) | For each item's Start and Span, you have the following options: Enter a number to nominate the start and span manually, |
All the costs associated with the above methodology of calculations are as below.
1. Master Development & Infrastructure
2. Statutory Fees & Insurance
3. Project Management Cost
4. Development Management Cost
5. Professional Cost
6. Technical Services Fees
7. FF & E
8. OS & E
9. Pre-Opening Cost
10. Construction Cost
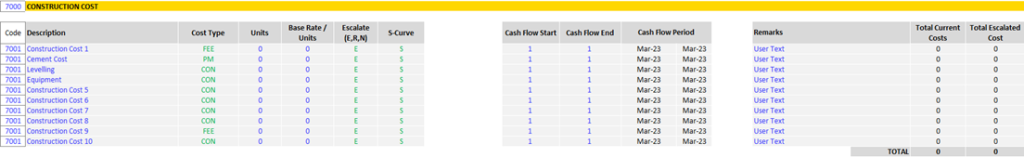
11. Overhead/Asset Management Cost
12. Marketing
13. Selling Cost
14. Contingencies
15. Misc Cost
16. Other Financing Cost
17. Other Selling Cost
6.13 Revenue Escalation Rates
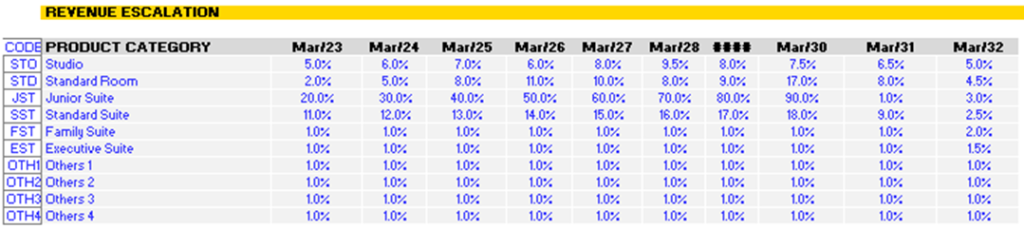
Escalation Rates can be defined for different categories of sales and rental revenue in the escalation table. Escalation rates can be set up in different ways:
Either on a Periodic Compounded Escalation basis (e.g., 5% per annum, which equates
to 0.41% compounded monthly)
- As a Positive (inflation) or negative (deflation) percentage.
Please refer to the Preferences on configuring the different escalation options
| Escalation Rates | For each relevant category you may enter up to 10 years of escalation rates. For Sales: Escalation rates apply to end sale values from the first escalation month. No escalation is applied once the product is sold. Where the first escalation month is identified as the first month in the escalation table and may changing depending on the preference to set escalation based on Cash Flow Period Years or Financial Years. |
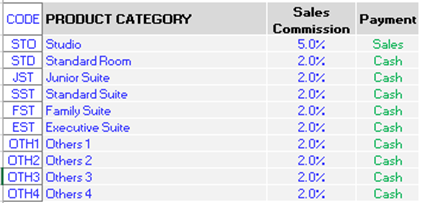
| Code and Category | You have the ability to define your own property categories (e.g. "Residential") and codes (e.g., "RS") for multiple escalation rates. 10 different property categories can all have different escalation rates; the code for each property category is defined by the user (1–3-character length allowed). Negative escalation rates can be inputted. |
6.14 Selling Costs
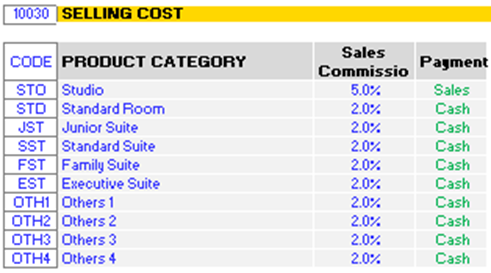
| Sales Commission (Optional) | For each relevant category you may enter sales commission. The first input column refers to sales commission as a percentage value. The sales commission can be calculated based on: Cash Revenue basis Sales commission under this option is calculated on the funds actually received against the sold product ie. Standard Room, Junior Room etc. Sales Revenue basis Sales commission under this option is calculated on the Sale achieved during the period for the product ie. Standard Room, Junior Room etc. |
6.17 Sales
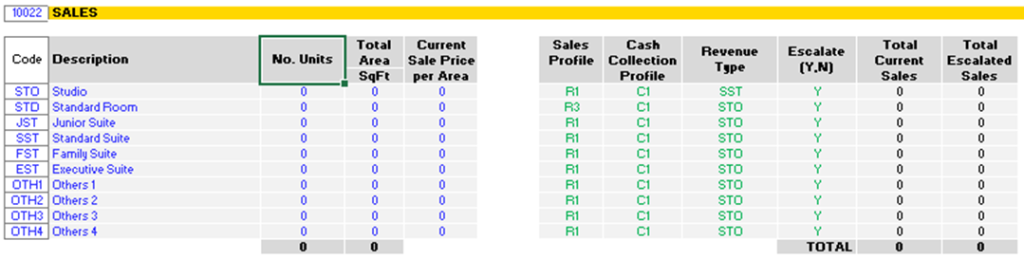
| Units and Area (Mandatory) | For each sale item it is mandatory to enter:
|
| Current Sale Price (Mandatory) | This is the current non-escalated sale price. This must be based on either the Units or Area measurement (i.e., $/unit or $/area) |
| Sale Calc Method (Mandatory) | Indicate the method of calculating the total current sale revenue. It is based on the 'Current Sale Price' * ‘Number of Units’ * ‘Total Area” |
| Sales & Cash Collection Profile (Mandatory) | Select a Profile Number under the Sales Profile & Cash Collection Profile to calculate the Revenue receipt based on the Sale & Cash collection defined in the “Sales & Cash Collection” Profile sheet. |
| Revenue Type (Mandatory) | The escalation in revenue is based on the Revenue Escalation profile selected and the rates corresponding to the selection. |
| Escalate (Mandatory) | The user is to define whether escalation is to be considered or not by selecting the “Y” or “N” option. |
6.19 Financing
6.19.1 Equity Inputs
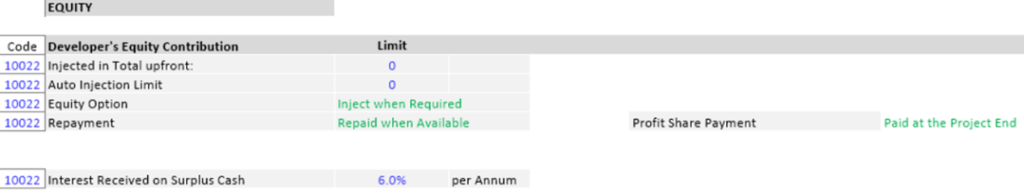
Equity
| Developer's Equity Contribution | Limit | |
| Injected in Total upfront: | 5,000,000 | |
| Auto Injection Limit | 4,500,000 | |
| Equity Option | Inject when required | |
| Repayment | Repaid when available |
- Injected in Total upfront: amount injected at period 1.
- Auto Injection Limit: This is the maximum limit for the cumulative amount that would be injected only when required in any respective period.
- Equity Options: Option to select whether equity is to be injected upfront or to be injected when required.
- Repayment: This option is for selection of Equity repayment method. Equity can either be repaid:
- whenever excess balance is available in any period or
- at the end of the project i.e., in the last period.
- Profit Share Payment: This option is for selection of payment method of profit. Profit can either be paid:
- whenever excess balance is available in any period or
- at the end of the project i.e., in the last period.
6.19.2 Loans 1 to 5 Inputs
- There are two types of Loans:
- Auto Loans
- Manual Loans
- Auto Loans (Loan 1 and Loan 2)
- Auto Loan will be automatically raised by the amount required in the respective period. Auto Loans are assumed to be available from the commencement of the project (i.e. first period itself). Maturity period for Auto loans is manually specified.
- The amount is raised in the beginning of the respective period.
- Auto Loan 1 is used first. Once it hits the limit and there is still requirement of funds not met, only then Auto Loan 2 will be used (before raising any amount from Auto Loan 2 facility, maximum limit of auto loan must be exhausted).
- Manual Loans (Loan 3, Loan 4 and Loan 5)
- Manual Loan will be raised as per period and Loan amount entered on the Input sheet.
Explanation of Input Options on the Input Screen:
- Loan 1 (Auto)
- Auto Injection Limit: It is the maximum (cumulative) limit up to which Loan 1 can be raised. Beyond the limit, Loan 2 will be triggered to fulfil the additional funding requirement.
- Maturity Period: Maturity period is manually entered. Repayment of Loan is made in equal instalments starting from present period till the Maturity Period manually entered here.
- Loan 2 (Auto)
- Auto Injection Limit: It is the maximum limit beyond which Loan 2 cannot fulfil the additional requirement.
- Loan 3, Loan 4 & Loan 5 (Manual Loan)
- Period Commencement: Period Commencement is decided manually here i.e. It is fully raised in the Period of commencement of Loan entered here regardless of the need in the chosen period.
Maturity Period: Maturity period is also manually entered. Repayment of Loan is made in equal instalments starting from present period till the Maturity Period.
6.20 Project Hurdle Rates
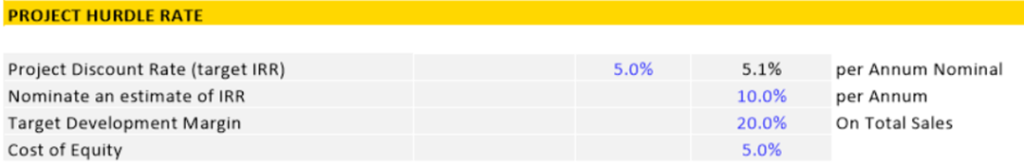
| Project Discount Rate (Target IRR) | The discount rate or target IRR only affects three performance indicators on the 'Summary' sheet: 1. Project Net Present Value (NPV), 2. Residual Land Value (based on a Zero NPV), and You can use the Preferences to change the discount rate calculation method (include or exclude finance costs and interest) and also the method of conversion from the annual discount rate to the monthly discount rate (quarterly or half yearly depending upon the rest period you selected). |
| Nominate an Estimate of IRR | This is a number that you guess is close to the result of IRR. The model uses an iterative technique for calculating IRR. Starting with the estimate, it cycles through the calculation until the result is accurate within 0.00001 percent. If it can't find a result that works a predetermined number of iterations, the #NUM! error value is returned. In most cases you do not need to provide the estimate for the IRR calculation. If it is omitted, it is assumed to be 0.1 (10 percent). Important Note About Multiple IRRs:
|
| Developer's Target Margin | The Developers Target Development Margin is the required profit margin calculated on either total development costs net of selling costs or including selling costs, total sales and rental income or on total net sales proceeds. These options can be chosen from the 'Hurdle Rates' tab of the Preferences. The target margin is used to calculate the residual land value to achieve the desired profit margin (Developer Target Development Margin); it does not take into consideration the time value of money. |
| Developer's Cost of Equity | Enter in the desired cost of the developer's equity. This is used to calculate the Weighted Average Cost of Capital on the Summary Report |
6.21 Manual Cash Flow Inputs
Project Revenues and Costs
The manual input rows for the revenues and costs can be hidden or shown via the 'Cash Flow Detail' utility on the Cash Flow.
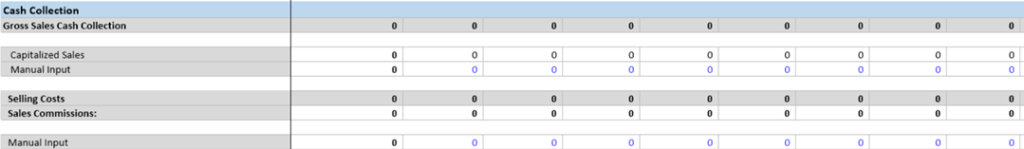
Notes about Manual Inputs:
All amounts put in the 'Manual Input' rows are added to the sub totals for that cost or revenue section.
The manual inputs have no provision for any escalation in costs and revenues over the period prescribed.
You may elect a percentage of the revenue/cost to be received/paid by the Landowner if you are modelling a joint venture arrangement.
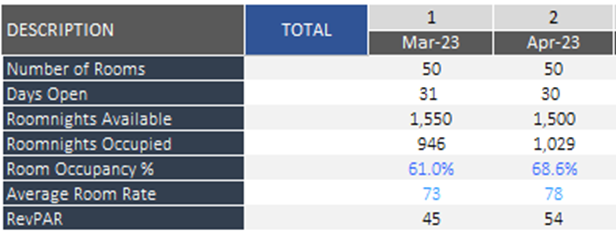
HOTEL P&L OPS
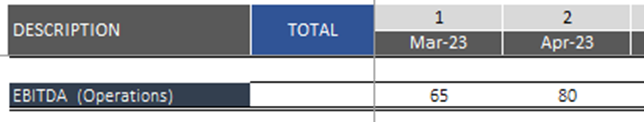
Calculates the EBITDA for the Hotel Operations as per the period specified in the preference tab.
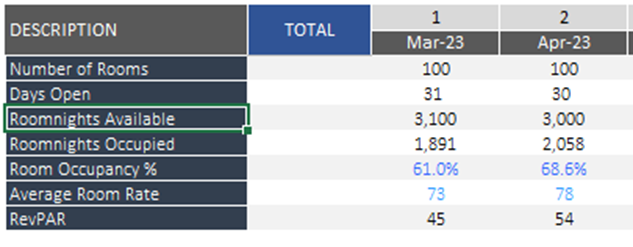
| Number of Rooms | Gives the number of rooms available for operations as per the data input in the INPUT sheet. |
| Days Open | Mentions the number of days during the month for which the rooms are available. |
| Room Occupancy % | User defined input mentioning the availability % of the rooms. |
| Average Room Rate | Price of the room per day |
| RevPAR | Revenue per available room is defined by the room rate and room occupancy %. |
HOTEL OPS - REVENUE
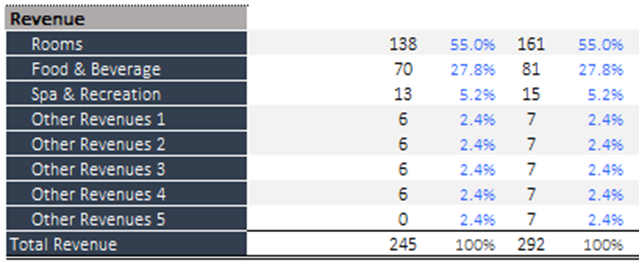
Based on the selection made above, the revenue from Rooms is calculated. Apart from the Room charges other revenue heads i.e. Food & Beverage, Spa & Recreation etc. can be calculated as per user-defined percentages.
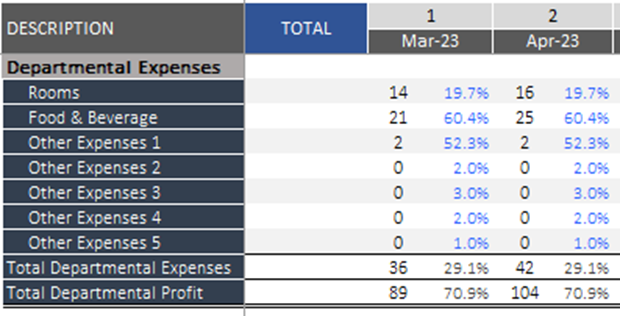
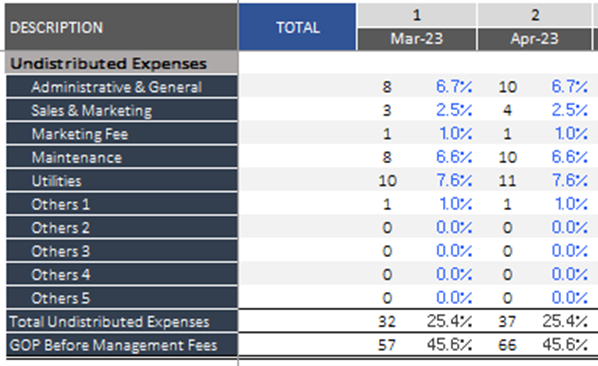
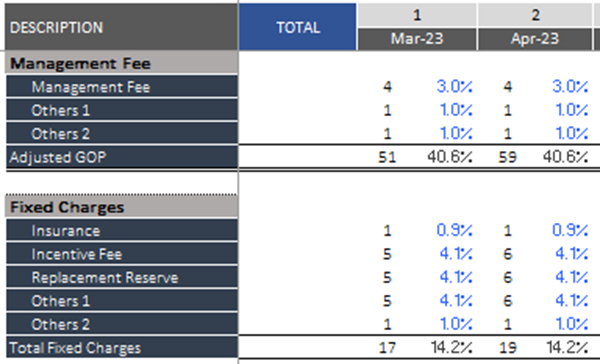
HOTEL OPS - COSTS
Different cost types are involved in the calculation ie. Department Expenses, Undistributed Expenses, Management Fee, Fixed Charges
Department Expenses – The user can define the % of each of the charges involved and arrive at the Total Department Profit.
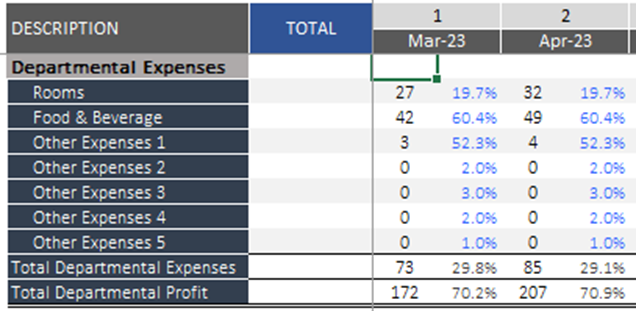
Other Costs i.e.. Undistributed Expenses, Management Fees and Fixed Charges can also be input with the % under each head, being user-defined.
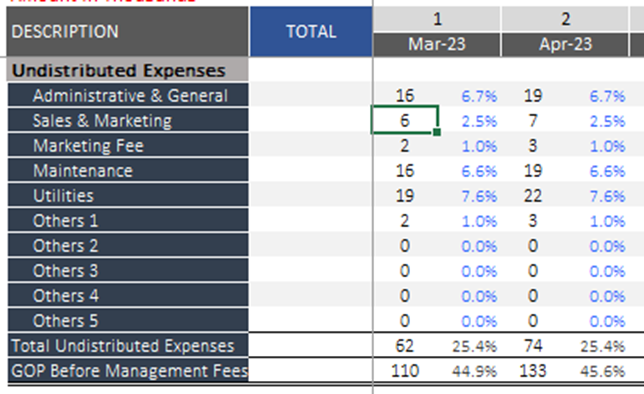
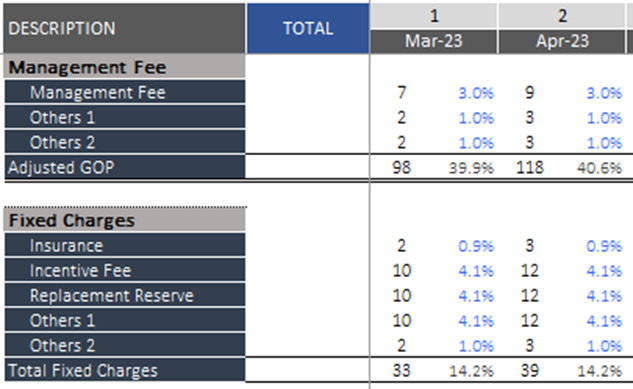
When all the data is specified the EBITDA from Operations is calculated in the end.
HOTEL P&L SOLD
Calculates the EBITDA for the Hotel Sold as per the period specified in the preference tab.
| Number of Rooms | Gives the number of rooms available for operations as per the data input in the INPUT sheet. |
| Days Open | Mentions the number of days during the month for which the rooms are available. |
| Room Occupancy % | User-defined input mentioning the availability % of the rooms. |
| Average Room Rate | Price of the room per day |
| RevPAR | Revenue per available room is defined by multiplying the room rate and room occupancy %. |
HOTEL SOLD - REVENUE
Based on the selection made above, the revenue from Rooms Sold is calculated. Apart from the Room charges other revenue heads i.e. Food & Beverage, Spa & Recreation, etc. can be calculated as per user-defined percentages.
HOTEL SOLD - COSTS
Different cost types are involved in the calculation i.e.. Department Expenses, Undistributed Expenses, Management Fee, Fixed Charges
Department Expenses – The user can define the % of each of the charges involved and arrive at the Total Department Profit.
Other Costs i.e.. Undistributed Expenses, Management Fees and Fixed Charges can also be input with the % under each head, being user defined.
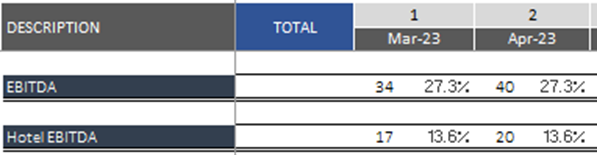
When all the data is specified the EBITDA from Hotel Sold arrives at in the end. The Profit Share on Keys Sold % as defined in the input sheet is the figure as mentioned in the Hotel EBITDA
Discount Rate
The discount rate is entered in the Input Sheet and that will form the basis of all IRR and NPV calculations on other reports, such as the Summary, Sensitivity, and Probability reports. In addition, it will also be used to report the following in the Cash Flow:
- The Present Value (PV) of net cash flow for each time period.
- The Net Present Value (NPV) of all future cash flows at each time period.
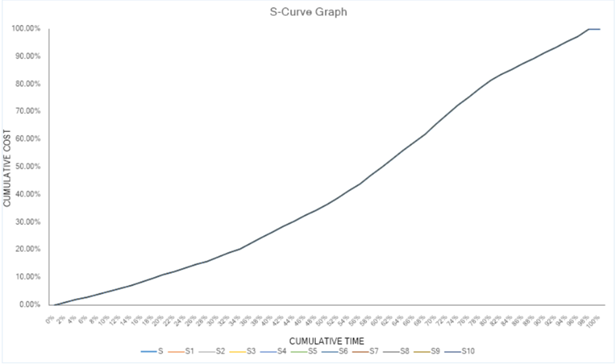
6.22.1 Cost Drawdown Profiles (S-Curves)
The S-Curve profiles are based on cumulative cost and cumulative time.
For example, in using the default S-Curve in the model (see Profile 'S' below), and assuming construction occurs over 10 months, then it would assume.
After 10% of the cumulative time (or 1 month over a 10-month span), 5% of the cumulative costs should have been drawn down (paid) in the cash flow to date.
After 20% (or 2 months over a 10-month span), 11% of the cumulative costs should have been drawn down, comprising 5% after one month and an additional 6%, and so on.
To show a cost drawdown that is skewed towards the earlier months of a span (more is paid earlier or quicker) ensure that the %'s increase earlier (see Profile 'S1' or 'S2' below
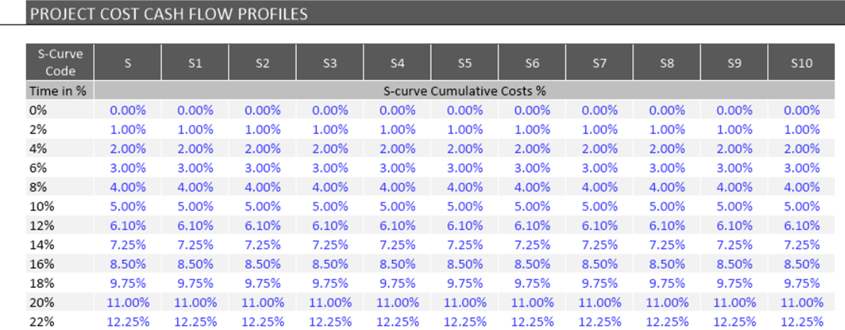
There are 11 profiles that can be customized ('S', 'S1' to 'S10') in this table and then subsequently applied to individual cost line items, using the drop-down input field.
A chart below the input table graphically displays each S-Curve Profile
Sales (Revenue) & Cash Collection Profiles
The Sales & Cash Collection Profile feature is enabled via the Preferences. It allows you to set milestones for receiving multiple payment installments from purchasers, either based on specific periods in the cash flow, or on the certain number of months after the Date of Sale for each sale item. There are 5 Sales and 5 Cash Collection Profiles that can be set.
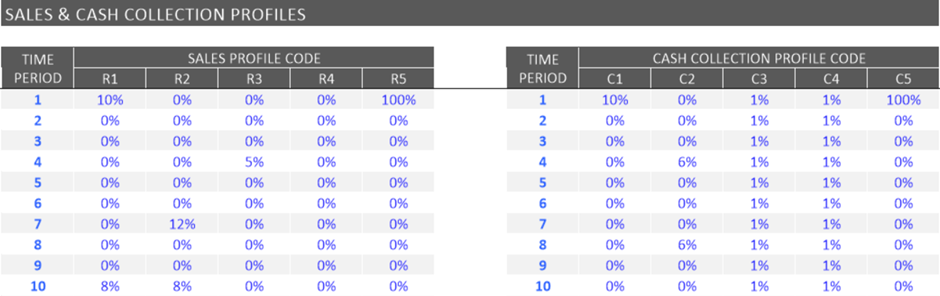
| Time Period | Specific Time Periods in the Cash Flow, e.g. Month 6, Month, 12, etc. A certain number of months after the Date of Sale for each sale item. When setting the installment timings, each subsequent installment must be later than the previous. There are up to 51 installments that can be set. |
| Instalment % | This is the % amount of the sale value that is paid by the purchaser and collected by the developer at the nominated instalment milestone. |
Release from Escrow

Example
(Assuming inputs as shown in the above image)
The developer receives $50,000 per year into the escrow account from Year 1 to Year 12, based on the “Sales Cash Collection Profile”.
Construction begins in Year 2 and is completed in Year 10.
| Period | Progress | Possible Withdrawal |
| Year 3 | Construction progress reaches 19%. | Since the minimum construction progress required for withdrawal has not been met, no funds can be withdrawn from the escrow account in this year. |
| Year 8 | Construction progress reaches 55%. Cost incurred is $360,000. | Cumulative escrow balance is $400,000. But only $360,000 can be released from escrow, as withdrawals for construction are limited to actual construction costs incurred. |
| Year 8 (alternative) | Construction progress reaches 65%. Cost incurred is $360,000. | the developer becomes eligible to withdraw both construction costs and profit, subject to the escrow retention requirement. Here, 5% of the escrow balance must still be retained, and the balance amount can be released. |
| Post Construction (Year 10) | 100% completion of construction | all escrow funds except the retention amount (5%) are released to the developer. |
| Year 13 | 100% completion of construction | At the end of this period, the remaining escrow balance [5%] is released to the developer |
Chapter 7
7. Custom Worksheets
The Feasibility.pro HF program is based on a spreadsheet interface and allows you to insert additional blank worksheets into the model.
Adding a Custom Sheet
Adding custom sheets is conducted via the 'Sheets' section in the Ribbon Menu.

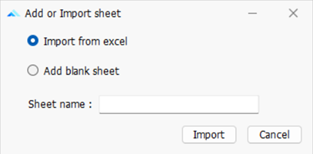
When you click on 'Add', there will be 2 options for adding a custom worksheet into the model:
1. Importing a sheet(s) from another Excel file: This will prompt you to browse an Excel file and select one or more worksheets in that file to import.
Important Notes:
- If you attempt to import a worksheet that has formula links to another worksheet, you will be required to import the other worksheet to avoid any links being broken, otherwise, you will not be able to import the worksheet.
- If you attempt to import a protected worksheet that has a password on it, you will be prompted to enter in the password before the worksheet can be imported.
- Any 'Global' range names (those that are global to a workbook) that exist on the worksheet to be imported will be disabled. Only 'local' range names (those that are local to a worksheet) will be imported with the worksheet. If you have a range name on the worksheet and you want it to be imported into Feasibility.pro HF, you will need to ensure they are 'local'. Refer to this Microsoft Article about using Global and Local range names: http://support.microsoft.com/kb/274504
- Any 'Local' range names (that exist on the worksheet to be imported) that refer to an external Excel workbook will be disabled.
- Any 'Local' range names (that exist on the worksheet to be imported) that have the same name as a Hotel Feasibility.pro HF Global Name will be renamed with "_RENAMED" appended to the end of the name. This means that any formulae that were referencing this name will be automatically adjusted.
2. Adding a blank worksheet: This will add a blank unprotected worksheet to the model.
Please Note:
Custom sheets are file-specific. They are not separately stored with storing Options. Therefore, since each Option may have different numbers of input rows and time periods between them, be careful when linking data from the standard sheets to the custom sheets, as the same cell reference may be referring to different items between them.
Therefore, if you are using Options and are linking inputs to the custom sheets, then you should either:
1. Do Not delete any rows/columns on the custom worksheet once you have stored an Option.
2. Have a separate worksheet for each Option, and only edit it while that specific Option is live
Custom worksheets will be saved to the data file (*.fphf).
Working with Existing Custom Sheets (Rename, Delete, etc.)
Once a sheet is added, you can do the following to it via the Ribbon Menu:
- Rename: Click on 'Rename', and a prompt will appear asking you to give the active sheet a different name.
- Delete: Click on 'Delete', and it will ask you to confirm the deletion of the active sheet.
- Change the Tab Color: Click on 'Tab Color', and a color picker will appear to allow you to customize the sheet's tab color.
Custom Sheets Formatting Menu
In addition to the context menu available for custom sheets, there is also a Ribbon Menu item that appears when a custom sheet is activated to assist with cell formatting.
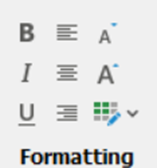
It contains the following functions:
- Setting the font to Bold, Italics and Underlined.
- Left, center or right aligning text.
- Setting the Font color. *
- Increasing or decreasing font size.
Chapter 8
8. INTEGRATION WITH MICROSOFT EXCEL
8.1 Linking to Excel Files
Just like in Excel, you can use this feature to either create a formula in Feasibility.pro HF that is referencing an external Excel file (an 'Incoming' link), or you can create a formula in an external Excel file that is referencing the Feasibility.pro HF file (an 'Outgoing' link).
Creating an Excel Link
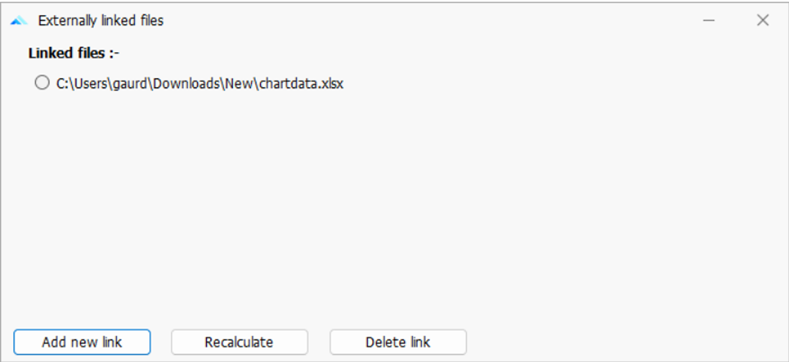
- Click on the [Excel] button in the ‘Office Links’ menu.
2. A dialog will appear. Click on the [Add New Link] button.
Please Note: Only 1 Feasibility.pro HF window (i.e. file) can be open when loading an external Excel file. If there are multiple Feasibility.pro HF windows open in the application, it will prompt you to close down the other windows before trying to add a new link.

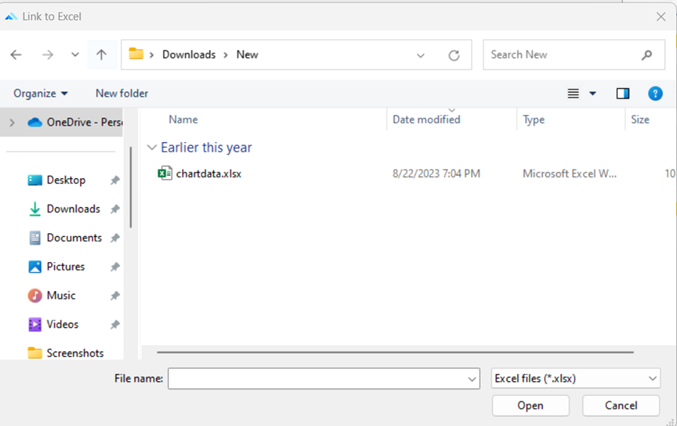
3. Browse to the Excel file you want to open and create links with. Select the file and press [Open].
4. The Feasibility.pro HF application window will re-adjust to show the Feasibility.pro HF file and Excel file as individual cascading windows.
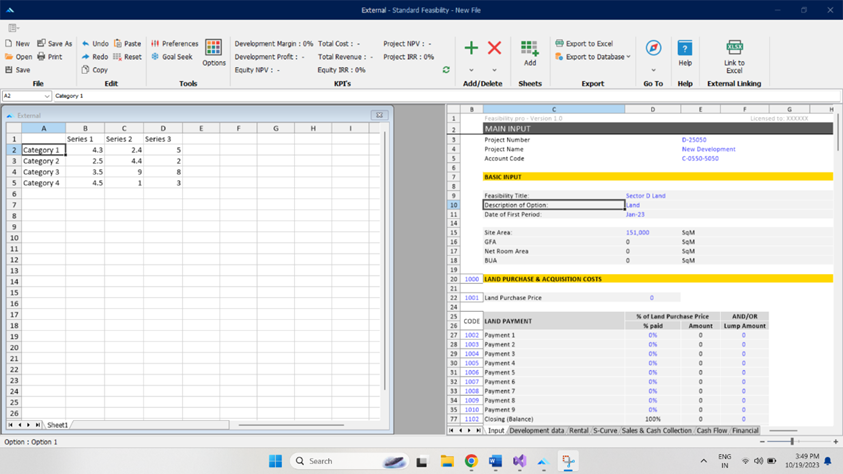
5. While these windows are displayed, you can write formulae in either one that references the other, just by selecting a cell, starting to write a formula, and then selecting the other file to select a cell/range to refer to in that formula.
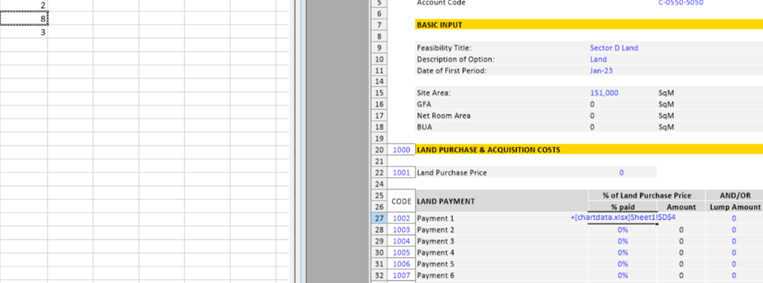
6. When you have completed linking your files, you will need to close the Excel file. This can be done by clicking on the Close button (red X) on the top right of the window.
7. If any changes were made to the Excel file, it will ask you if you want to save these changes before closing the file.
Please Note: If you save the file, some features that are not completely supported by this spreadsheet interface may be lost (including, but not limited to, items such as Form/ActiveX Controls, Pivot Charts, Cell Comments, Cell Gradients, Excel 2007-style Conditional Format options, Excel 2007-style Tables and Structured References, OLE objects (Camera, Embedded Documents, etc.) and Shape fill effects and shadows).
8. At any time, you can click on the [Excel] button in the ‘Office Links’ menu to reload the dialog where you can:
View a list of all files linking to the Feasibility.pro HF file, where they are located, and whether they have Incoming, Outgoing, or multi-directional links.
Click [Break Link], to remove the selected Excel file from being linked to the Feasibility.pro HF files. After the file is saved and re-opened, any formulas in the Feasibility.pro HF file that were referencing this Excel file will be:
- On Standard Worksheets: Loaded as its last known calculated ‘value’ (no formula). This will allow the model to continue calculating without issues.
- On Custom Worksheets: Converted to text, by adding an apostrophe before the '=' in the formula. This will allow the user to check and amend the formula where necessary.
- Click [Change Source], to change the location of the selected Excel file. This will prompt you to browse to another file, and the program will search for all formulae where the old Excel file was referenced and replace it with the name of the newly selected Excel file. During such a process, if any of the formulae becomes invalid (due to the worksheet or range name that existed in the old Excel file, but not in the new one), the following will occur to such formulae:
- On Standard Worksheets: Converted to its last known calculated ‘value’ (no formula). This will allow the model to continue calculating without issues.
- On Custom Worksheets: Converted to text, by adding an apostrophe before the '=' in the formula. This will allow the user to check and amend the formula where necessary.
- Click [Open File] to open the selected Excel file again to change/add links.
- Click [Refresh Values] to momentarily open the selected Excel file to refresh the results.
- Click [Add New Link] to add a link to another Excel file.
Chapter 9
9. STORING AND RECALLING OPTIONS
9.1 Using the Options Function
Using the 'Options' function on the Ribbon Menu, you may compare up to eight different development options using the 'Consolidate' report within the one Feasibility.pro HF file.
| Examples of how Options could be used | Option 1 | Option 2, etc. |
| Development Options | 250 Keys Hotel | 200 Keys Hotel |
| Feasibility / Sensitivity Scenarios | no escalation on sales | 5% per annum escalation |
| Phases | Acquisition and Hold | Development and Disposal |
9.2 Storing
Once you are satisfied that all the inputs have been entered for a particular Option, you may store this by using the 'Options' function and selecting where to store the data before clicking on the 'Save new option' button.
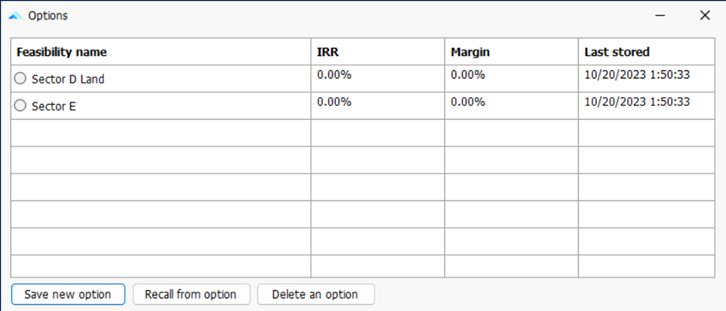
Before the storing process begins, the program will check that the user has entered a unique 'Feasibility Title' in the Preliminary input section. If it is blank, or not unique to the other Options that have been stored already, it will not proceed.
On successful execution, the following input data ranges are stored:
- 'Input' sheet data;
- 'Manual Input' data from the Cash Flow tables (includes manual adjustments to the financing and variable discount rates);
- S-Curve and Revenue Collection Profile tables.
- Sensitivity Analysis; and
- All Preferences.
Storing enables you to make changes to the input data while retaining the original data. Once a change is made, storing it as Option 2 can create a new option. The original Option 1 can be retrieved at a later date for further analysis.
Storing Options
When using the Save and Recall feature to compare different development scenarios, it is recommended that you keep the following Hurdle rate options in the Preference so that the performance indicators which are calculated for each scenario are consistent.
- Development Margin calculation
- IRR and NPV calculation.
- Discount Rate Conversion – Nominal or Effective
9.3 Recalling
To change data in an option that has been previously stored, it is recommended that you 'Recall' the relevant data back into the input data ranges. This is achieved by using the 'Recall from option” from the 'Options' function and deciding what Option to recall.
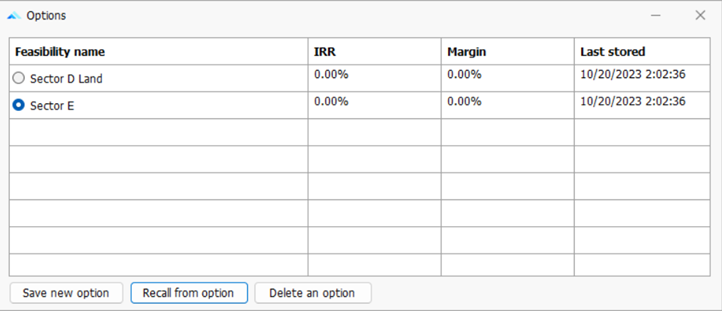
When recalling options, the model will replace the existing data in the input ranges with that of the option being restored.
Remember to store information in the input ranges to an option sheet before recalling an option.
9.4 The Consolidate Report
Using the 'View Comparison/Consolidate' button at the top of the 'Consolidate' report, the user can change how the results are reported:
- Comparing the 'Options', where up to 8 columns of reporting data are made available for each scenario, providing a summary of the performance indicators for all Options or Scenarios that were previously stored.